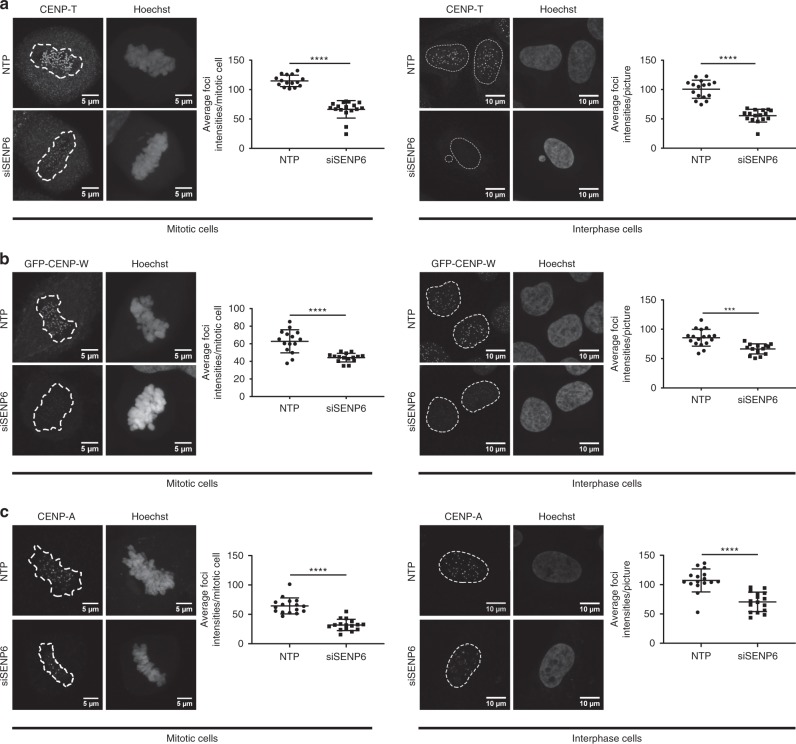
Fig. 6.
Poly-SUMO2/3 prevents accumulation of CCAN proteins at centromeres. a U2OS cells were transfected either with a pool of four siRNAs against SENP6 (siSENP6) or a pool of four nontargeting siRNAs (NTP). Cells were fixed and stained with Hoechst to visualize DNA and CENP-T antibody 2 days post transfection. Panels show representative pictures of mitotic (left panel) and interphase cells (right panel). Scatter plots show quantifications of the average CENP-T foci intensities per cell (for mitotic cells) or per picture (for interphase cells). A two-sided t-test was performed. ****p < 0.0001. n (NTP mitotic cells) = 15; n (siSENP6 mitotic cells) = 16; n (NTP interphase cells) = 16; n (siSENP6 interphase cells) = 16. Dashed lines indicate areas of DNA. b U2OS cells stably expressing GFP-CENP-W were treated as in panel a. Cells were fixed and stained with Hoechst to visualize DNA and GFP antibody to enhance GFP signal. Left panels show representative pictures of mitotic (left panels) and interphase cells (right panels). Scatter plots show quantifications of the average CENP-W foci intensities per cell (for mitotic cells) or per picture (for interphase cells). A two-sided t-test was performed. ****p < 0.0001; ***p < 0.001. n (NTP mitotic cells) = 15; n (siSENP6 mitotic cells) = 15; n (NTP interphase cells) = 16; n (siSENP6 interphase cells) = 16. c U2OS cells were treated as in panel a, fixed and stained with Hoechst to visualize DNA and CENP-A antibody 2 days post transfection. Panels show representative pictures of mitotic (left panel) and interphase cells (right panel). Scatter plots show quantifications of the average intensities of CENP-A foci per cell (for mitotic cells) or per picture (for interphase cells). A two-sided t-test was performed. ****p < 0.0001. n (NTP mitotic cells) = 16, n (siSENP6 mitotic cells) = 16; n (NTP interphase cells) = 16, n (siSENP6 interphase cells) = 16. Dashed lines indicate areas of DNA. Scale bars = 5 µm (mitotic cells), 10 µm (interphase cells). All error bars shown represent standard deviation (SD). Source data are provided as a Source Data file

