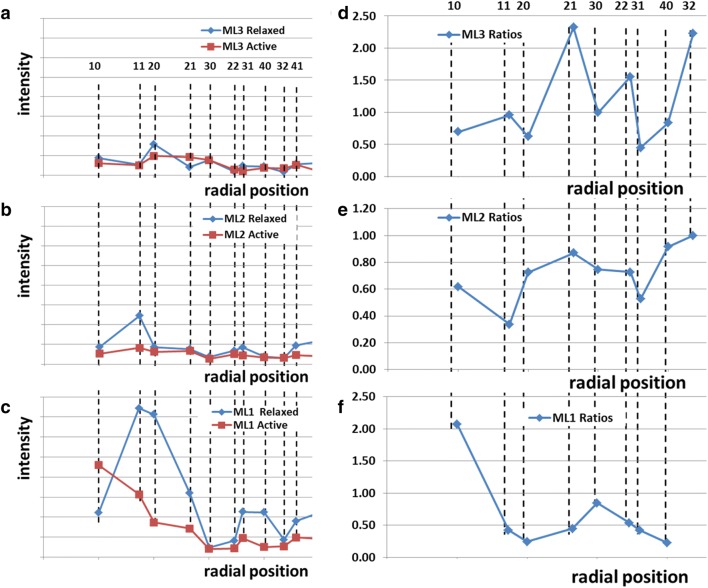
Fig. 3.
a Traces of the fitted intensities along the first three myosin layer lines (ML1, ML2 & ML3) from both resting (diamonds) and active (tetanus plateau: squares) diffraction patterns from bony fish muscle. Integration limits were: layer line 1: 0.0143 to 0.0306 nm−1; layer line 2: 0.0374 to 0.0536 nm−1; layer line 3: 0.06173 to 0.0779 nm−1. d–f Plots of the ratios (active/resting) of the peak intensities on the first three myosin layer lines. If the active intensities were just a weaker version of the resting pattern, as might occur if there were some fibres in the muscle that had not been activated, then the intensity ratios would all lie along horizontal lines. They do not do this, showing that the active layer lines are from a different crossbridge configuration from that in resting muscle. Numbers above the dashed lines indicate the row-line indices h and k

