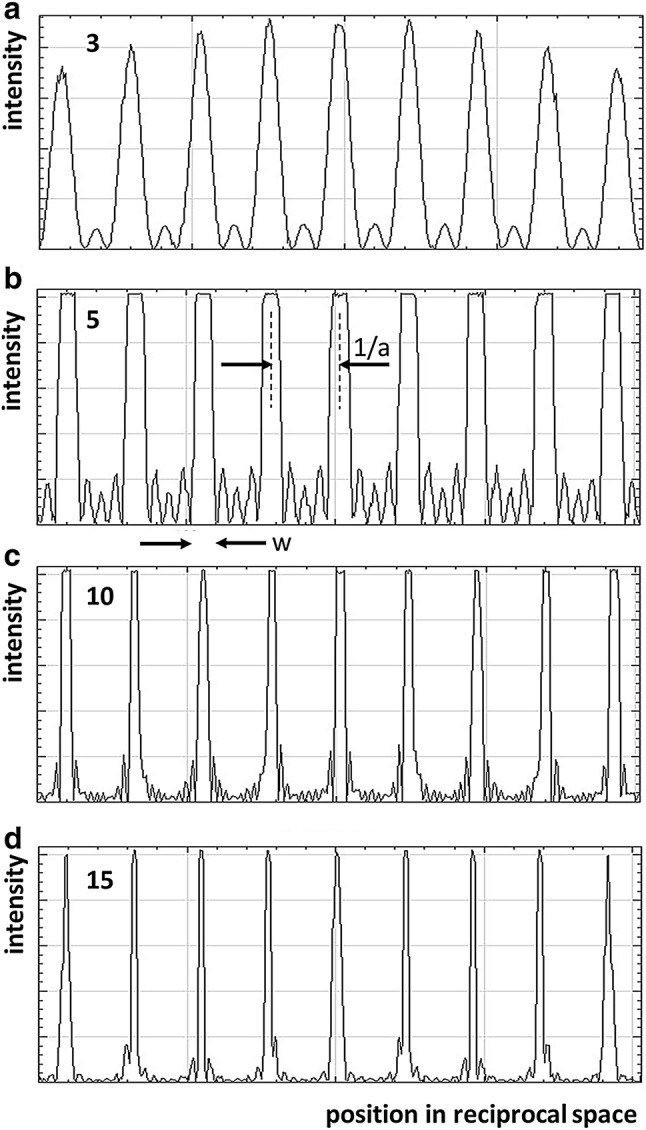
Fig. 5.

a–d Intensity profiles (lower parts) of the computed diffraction patterns from one-dimensional arrays of dots in arrays of varying length, but with the same repeat (separation between dots) ‘a’. (Intensity vertical against position in the diffraction pattern horizontal). The number of repeats from the top is a 3, b 5, c 10 and d 15. It can be seen that, as the array size increases, the width w of the peaks (here full width at the peak base—see arrows in plot in b as an example) reduces systematically. In other words, the extent of the array can be determined from the width of the peaks. Patterns were generated using the HELIX program (Knupp and Squire 2004) and plots were created in Fiji
