
Fig. 8.
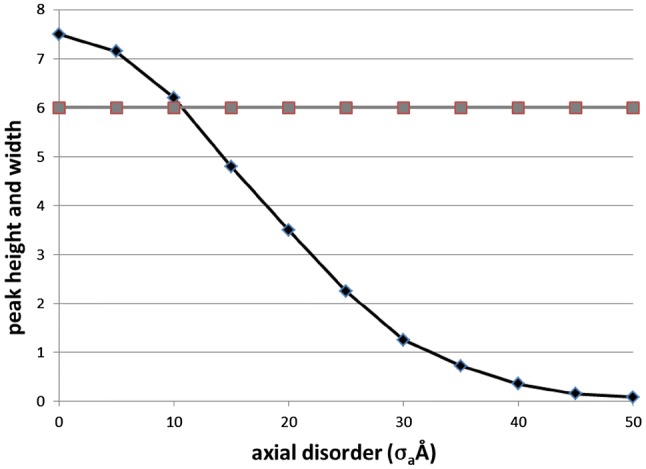
Plots of the M3m peak height (black line, diamonds, arbitrary scale) and peak width (grey line, square symbols, pixels) from calculations similar to those illustrated in Fig. 7. As the axial disorder increases the peak height of the M3m drops systematically, but the peak width remains constant