
Figure 3.
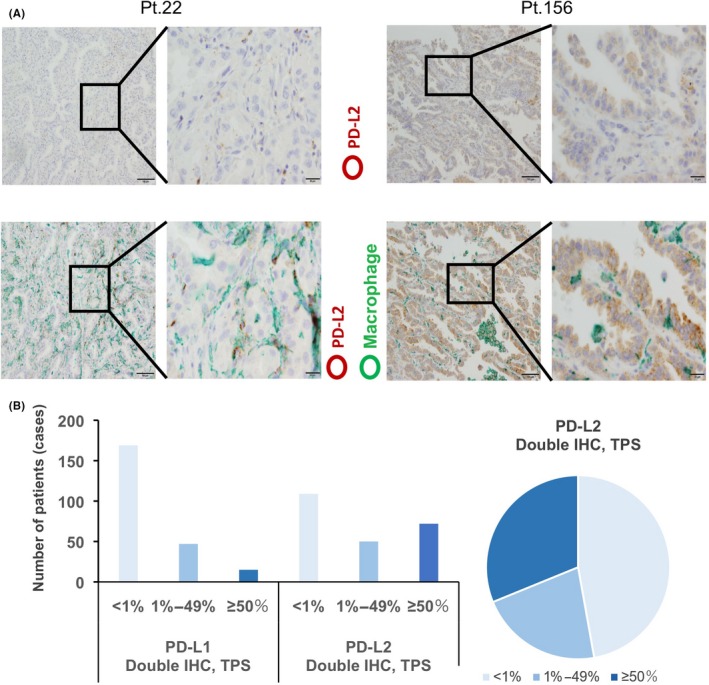
Anti‐programmed death ligand 2 (PD‐L2) immunohistochemistry (IHC). A, Single IHC of PD‐L2 (upper panels) and double IHC of PD‐L2 and Iba‐1 (lower panels). Representative images from PD‐L2‐negative (left side) and anti‐programmed death ligand 1 (PD‐L1)‐positive (right side) cases are presented. PD‐L2 and Iba‐1 signals were labeled as brown and green, respectively. B, The number of cases for each PD‐L1 and PD‐L2 tumor proportion score (TPS) and percentages of PD‐L2 TPS by double IHC are presented