Figure 3.

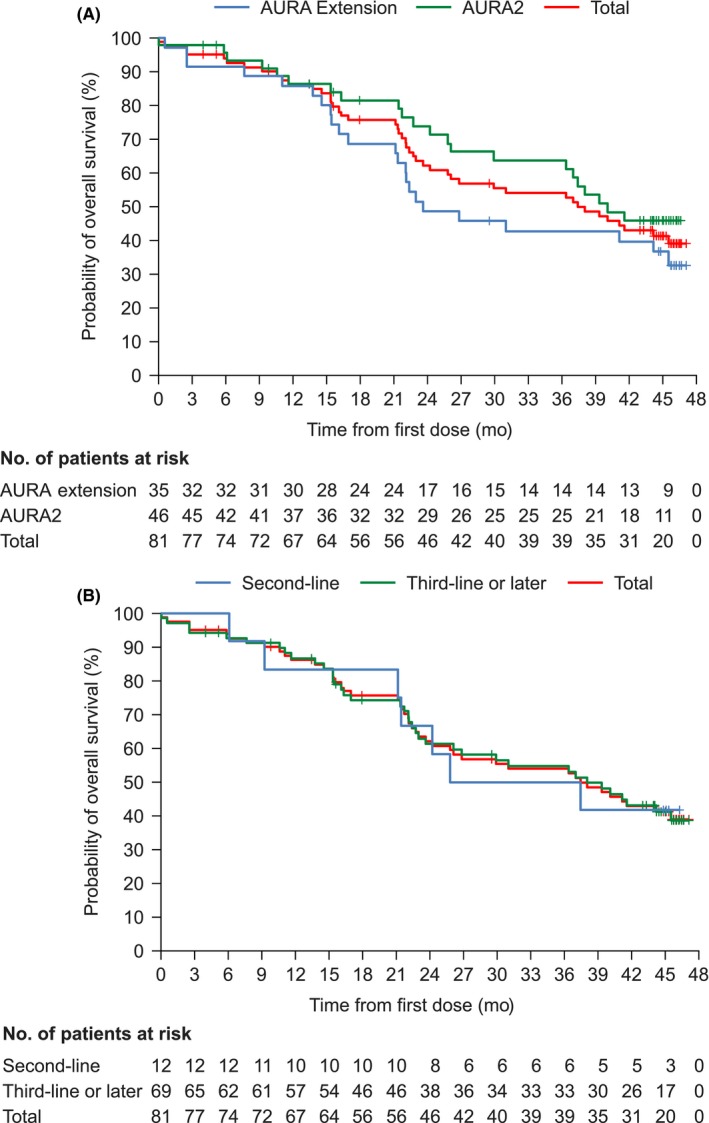
Kaplan‐Meier plots of the probability of overall survival by AURA Extension and AURA2 cohorts (A) and by line of treatment (B). Full analysis set (n = 81). Data cut‐off date: 1 May 2018

Kaplan‐Meier plots of the probability of overall survival by AURA Extension and AURA2 cohorts (A) and by line of treatment (B). Full analysis set (n = 81). Data cut‐off date: 1 May 2018