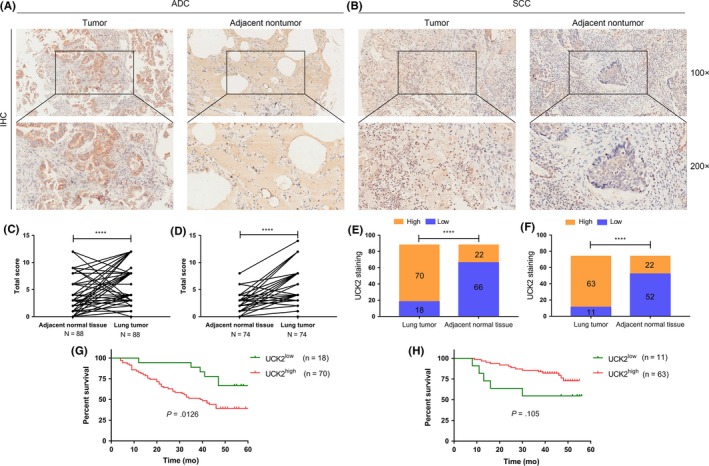
Figure 3.

Immunohistochemistry of lung cancer tissues. A,B, Representative images of lung cancer patients by immunohistochemistry (magnification, 100×; 200×). C, Total scores of lung cancer and adjacent nontumor tissues of adenocarcinoma (ADC) patients. D, Total score of lung cancer and adjacent nontumor tissues of squamous cell carcinoma (SCC) patients. E, Plot of the distribution of uridine‐cytidine kinase 2 (UCK2) expression in tumor tissues and adjacent nontumor tissues of ADC patients. F, Plot of the distribution of UCK2 expression in tumor tissues and adjacent non‐tumor tissues of SCC patients. G, Overall survival curves for ADC patients with high (n = 70) and low (n = 18) UCK2 expression. H, Overall survival curves for SCC patients with high (n = 63) and low (n = 11) UCK2 expression. ****P < .0001. IHC, immunohistochemistry
