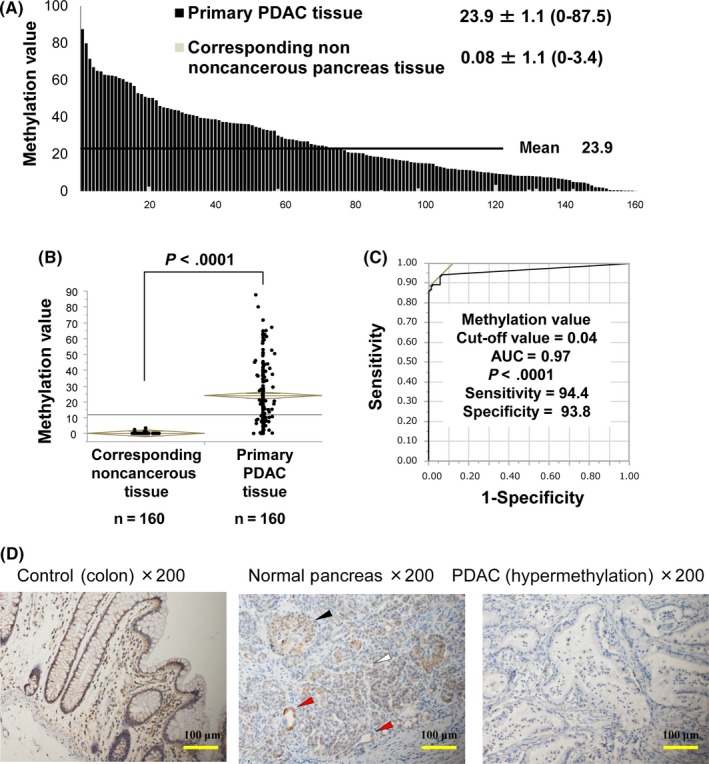
Figure 2.

Methylation value (MV) of CDO1 promoter DNA in 160 primary pancreatic ductal adenocarcinoma (PDAC) tissues. A, Quantitative methylation‐specific PCR assessment was used to examine the MV in 160 primary PDAC tissues and 160 corresponding noncancerous pancreatic tissues (CN). B, MV of CDO1 was significantly different between primary PDAC tissue and CN (P < .0001). C, Receiver operating characteristic curve of CDO1 methylation to differentiate primary PDAC tumors from CN. The area under the curve (AUC) represents the accuracy in discriminating normal from tumor tissue in terms of sensitivity and specificity (AUC = 0.97, P < .0001). D, Representative images of immunostaining with an anti‐CDO1 Ab are shown. Colon tissue is shown as a positive control. In NC, CDO1 protein was expressed in epithelium (red arrows), islet (black arrow), and acinar cells (white arrow). In the PDAC tissue, CDO1 protein was not expressed in epithelium
