
Figure 1.
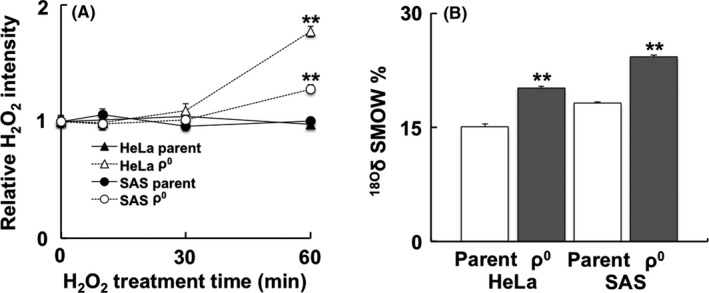
Internal levels of H2O2 and intracellular intake of H2O2 in ρ0 cells. A, Temporal change of H2O2 after treatment with H2O2 in ρ0 and parental cells using HYDROP™. In ρ0 cells, the relative H2O2 intensity was increased after treatment with H2O2 for 1 h. B, The intracellular intake of H2O2 was detected using a stable isotope. Cells were subjected to 50 μmol/L of H2O2 18O2 solution, and the content of 18O2 was measured using stable isotope‐ratio mass spectrometry. In ρ0 cells, the intake of H2O2 was significantly higher than that observed in parental cells after treatment. The results are expressed as the mean ± SEM. **P < .01 using Student's t test