
Figure 7.
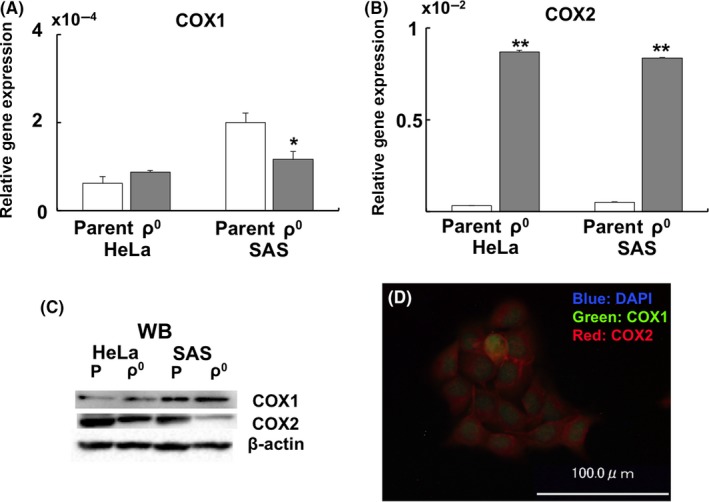
Gene and protein expression of COX. A, Relative gene expression of COX1. B, Relative gene expression of COX2. C, Western blotting of COX1 and COX2. D, Spatial distribution of COX1 (green) and COX2 (red) in SAS parent cells. The results are expressed as the mean ± SEM. *P < .05, **P < .01 using Student's t test