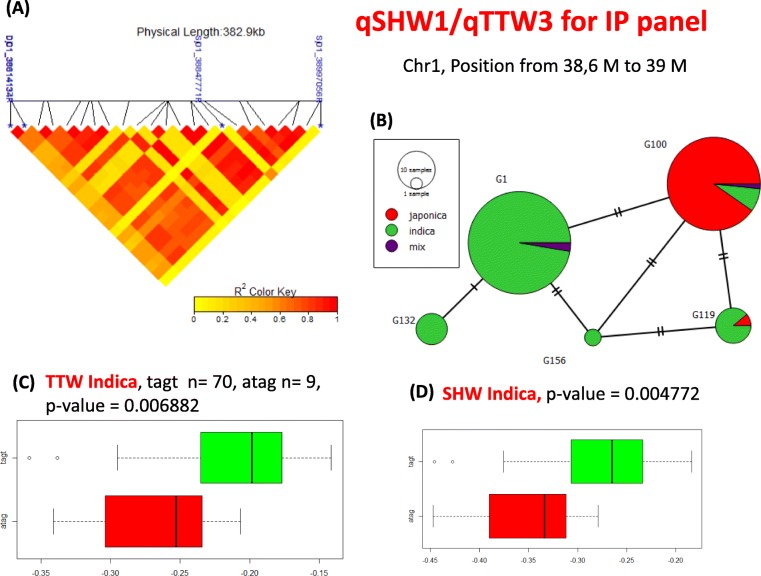
Fig. 7.
Haplotype analysis for qSHW1/qTTW3 a Linkage Disequilibrium heatmap in the peak region of association analysis GWAS for qSHW1/TTW3. Significant SNP indicated as blue star in the photo and the pattern pairwise r2 of the associated SNPs in the QTL indicated with color code. Red color means SNPs are strongly associated to each other and yellow color means no association. The Linkage Disequilibrium heat map was created using the “LDheatmap” package in R b Population architecture of accessions based on the allelic combination significant SNPs in each QTL. Population architecture image is created by PopArt1.7 software. c and d Effect of allelic combination of 2 main haplotypes of each QTL on the value of interested traits. Number of accessions for each haplotype is indicated as (n). Welch Two Sample t-test was used to assess the differences between two haplotypes. *, **, *** indicated significant difference at p value < 0.05, 0.01 and 0.001 respectively

