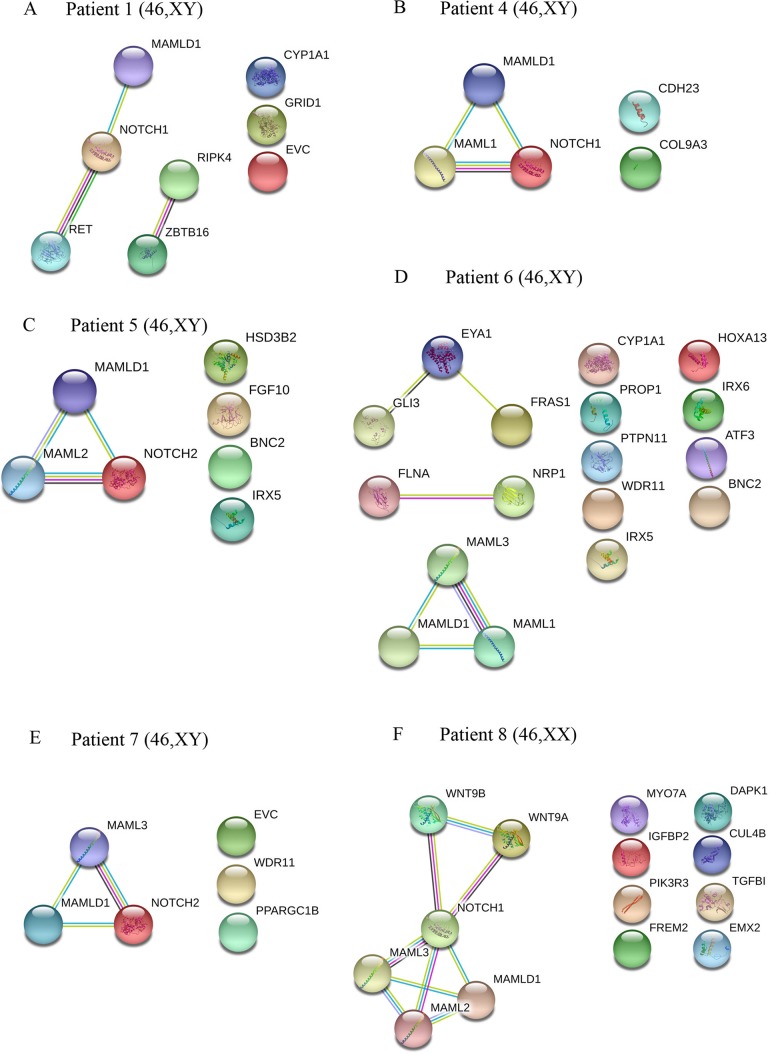
Figure 2.
Interaction networks of DSD- and MAMLD1-related genes identified per single MAMLD1 individual. (A) to (F) correspond to the interaction networks per patient. For the search for functional human partner, the Search Tool for the Retrieval of Interacting Genes/Proteins (STRING, http://string-db.org/) was used. Nodes represent proteins. Filled nodes show proteins with known or predicted 3D structure. Empty nodes depict proteins with unknown 3D structure. Candidate genes are underlined. Known interactions correspond to curated databases (turquoise lines) and experimentally determined interactions (pink lines). Predicted interactions correspond to gene neighborhood (green lines), gene fusions (red lines) and gene co-occurrence (blue lines). Other interactions correspond to text mining (yellow lines), co-expression (black lines) and protein homology (violet lines). Genes with no interactions are on the right side of each network.

