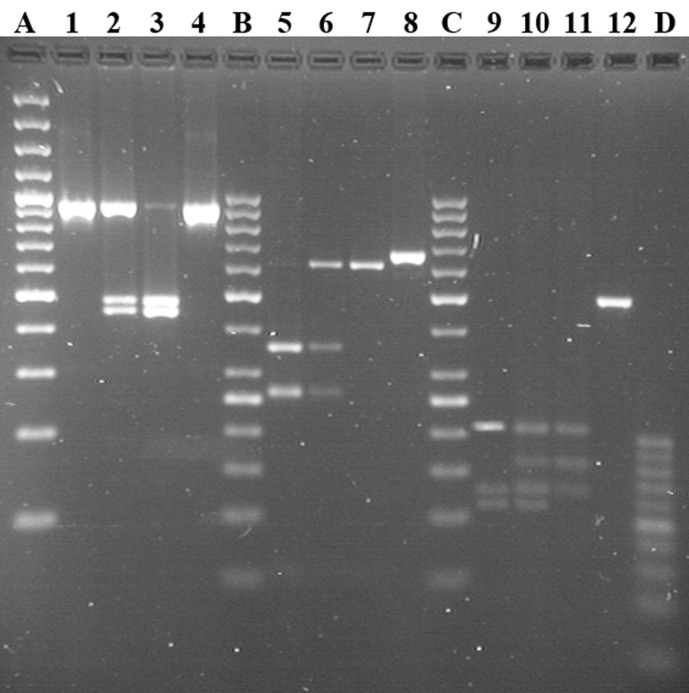
Figure 3.
Genotyping of CSN1S1, CSN2, and CSN3 by PCR-RFLP in Sudanese and Nigerian dromedary populations. Lines 1–4: locus CSN1S1 c.150G > T; genotypes TT, GT, and GG reported in lines 1, 2, and 3, respectively. Lines 5–8: locus CSN2 g.2126A > G; genotypes GG, AG, and AA reported in lines 5, 6, and 7, respectively. Lines 9–12: locus CSN3 g.1029T > C; genotypes CC, TC, and TT reported in lines 9, 10, and 11, respectively. Lines 4, 8, and 12 show undigested PCR products each belonging to the relative locus. Line A shows the GeneRuler™ 100 bp plus DNA Ladder (Thermo Scientific). Lines B and C show GeneRuler™ 50 bp DNA Ladder (Thermo Scientific). Line D shows 20bp DNA Ladder (Jena Bioscience).

