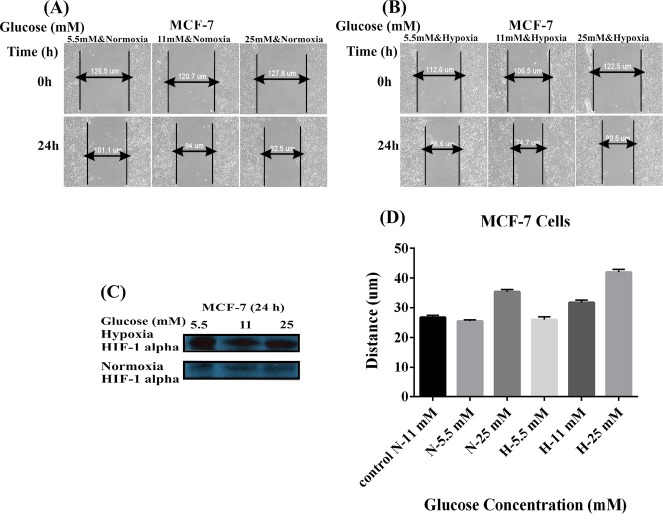
Fig. 2.
Effects of glucose concentrations and hypoxia on the MCF-7 cell migration. Panels A and B represent the effects of different concentrations of glucose (5.5, 11, and 25 mM) under the normoxic (A) and hypoxic (B) conditions on the cell migration. (C) Western blot analysis of HIF-1 alpha in the MCF-7 cells treated with different concentrations of glucose under the normoxia and hypoxia after 24 hours. Panel D shows the effects of the normoxia (A) and hypoxia (B) on the migration of MCF-7 cells treated with different concentrations of glucose. N: Normoxia; H: Hypoxia.

