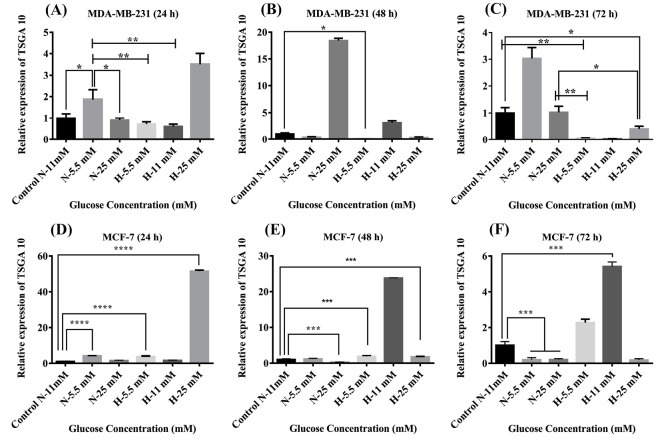
Fig. 3.
The TSGA10 mRNA expression in the MDA-MB-231 and MCF-7 cells. Baseline TSGA10 mRNA expression levels in breast cancer subtypes of MDA-MB-231 and MCF-7 were evaluated by real-time PCR. Extracting total RNA and normalized to GAPDH mRNA expression levels in (A) 24 hours, (B) 48 hours, and (C) 72 hours for MDA-MB-231 and (D) 24 hours, (E) 48 hours, and (F) 72 hours for MCF-7. The data show mean values ± SD. The one-way ANOVA was used for the statistical analysis. *P ≤ 0.05, **P ≤ 0.01, ***P ≤ 0.001, and **** P ≤ 0.0001.

