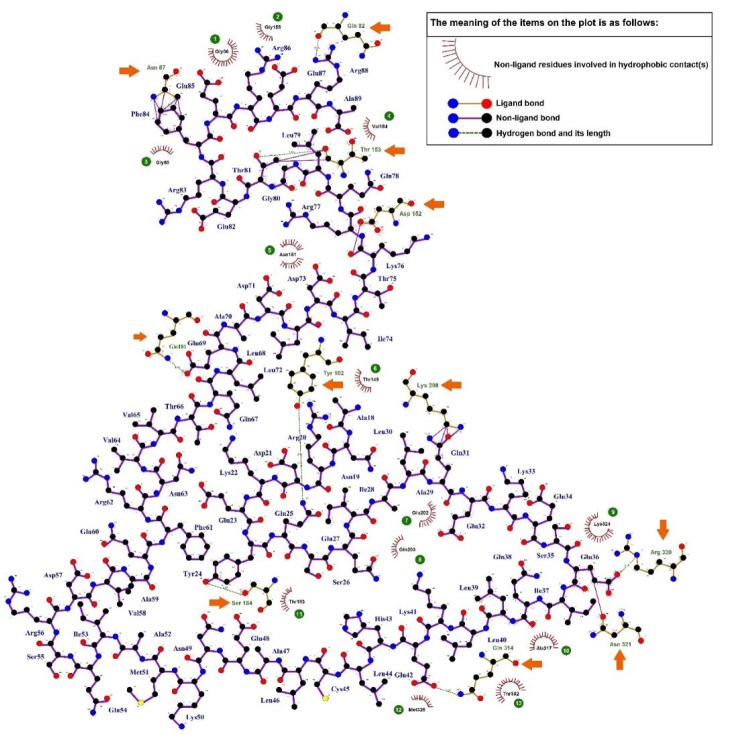
Fig. 5.
Two-dimensional plot of the intramolecular interactions between the TSGA10 domain (556 - 689) and HIF-1α. The hydrogen bonds (green dotted lines) and the hydrophobic contacts (red spline curves) are shown in the diagram. The legend is observable in the plot. The hydrophobic contacts are numbered in the plot and the hydrogen bonds are marked with the orange arrows.

