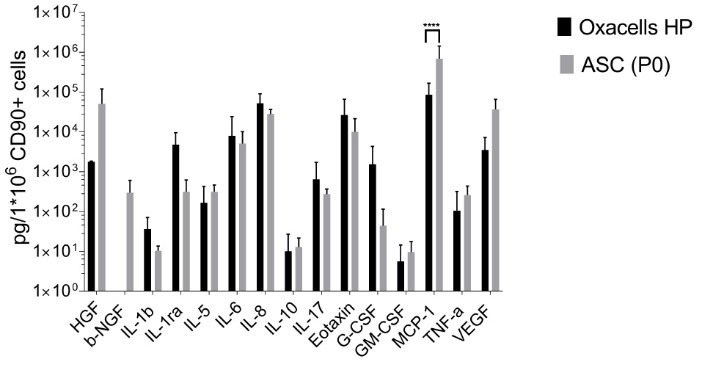
Fig. 6.

Concentrations of cytokines and growth factors in the supernatants of Oxacells HP and adipose-derived stem cells. The concentration of 15 analytes (Hepatocyte Growth/scatter Factor = HGF, Nerve growth factor beta = b-NGF, Interleukin-1 beta = IL-1 b, Interleukin-1 receptor antagonist = IL-1ra, Interleukin-5 = IL-5, Interleukin-6 = IL-6, Interleukin-8 = IL-8, Interleukin-10 = IL-10, Interleukin-17 = IL-17, Eotaxin-1, Granulocyte-Colony Stimulating Factor = G-CSF, Granulocyte-Macrophage Colony-Stimulating Factor = GM-CSF, Monocyte Chemotactic Protein 1 = MCP-1, Tumor Necrosis Factor alpha = TNF-a and Vascular Endothelial Growth Factor = VEGF) was measured in the supernatants of Oxacells HP and adipose-derived stem cells by multiplex technique described in material and methods. All measured concentrations were normalized to 1 x 10⁶ CD90+ cells. Plotted were mean values ±SD of multiple measurements (Oxacells HP n=6, ACSs n=8) on a logarithmic scaled Y axis. Significant differences between Oxacells HP and ASCs (P0) are marked (* P < 0.05, ** P < 0.01, *** P < 0.001, **** P ≤ 0.0001).
