Figure 3.
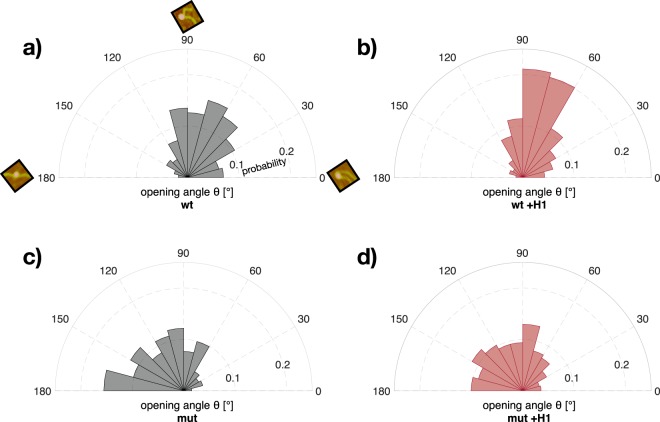
DNA opening angles are affected by mutation and histone H1 interaction. Normalized probabilities of the opening angles θ were plotted in 15° binned sectors for the different cases. The small example images in (a) represent nucleosome objects with the corresponding DNA opening angle. For each case, (a) wt, (b) wt +H1, (c) mut and (d) mut +H1 all opening angles are plotted (nwt = 444, nwt +H1 = 445, nmut = 444, nmut +H1 = 448). Diagrams for samples with histone H1 are shown in red. Linker histone H1 induces a distinct population between 60° and 90° in the distribution of the opening angle for wt. Compared to wt, mutated nucleosomes show higher opening angles.

