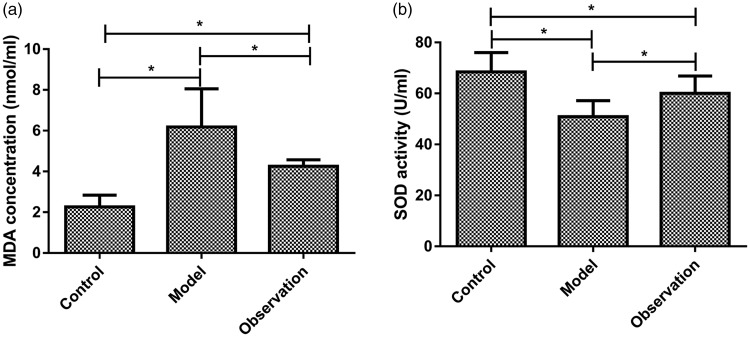
Figure 4.
Comparisons of serum MDA concentrations and serum SOD activities among the three groups. At 24 hours after sepsis modeling, carotid blood was collected and centrifuged for separation of serum. (a) Comparisons of serum MDA concentrations among the three groups: the serum MDA concentration was significantly higher in the model group than in either observation or control groups (P < 0.05); serum MDA concentration was significantly higher in the observation group than in the control group (P < 0.05). (b) Comparisons of serum SOD activities among the three groups: the serum SOD activity was significantly lower in the model group than in either observation or control groups (P < 0.05); serum SOD activity was significantly lower in the observation group than in the control group (P < 0.05).
*P < 0.05, MDA, malondialdehyde; SOD, superoxide dismutase.

