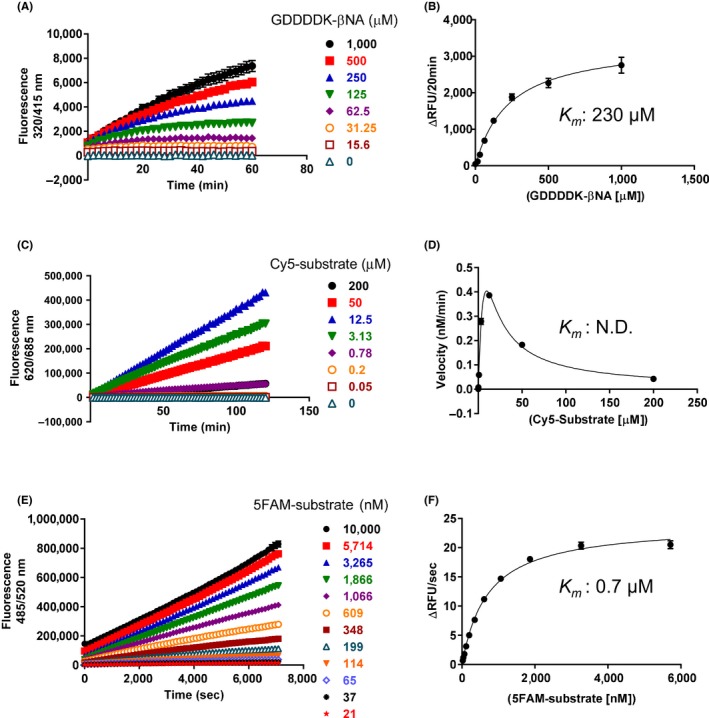
Figure 1.

Time course and determination of K m value of enteropeptidase for various substrates. Enteropeptidase and various concentrations of GDDDDK‐βNA (A), Cy5‐substrate (C), and 5FAM‐substrate (E) were incubated in enteropeptidase assay buffer in a 384‐well plate at room temperature, and the fluorescence was measured. The final concentrations of enteropeptidase were 10 U/mL for GDDDDK‐βNA, 31.3 mU/mL for Cy5 substrate, and 8 mU/mL for 5FAM substrate. Data are presented as mean ± SE values (n = 4). Initial velocities from (A, C, E) are plotted in (B, D, F) as functions of substrate concentration. The data were analyzed using the Michaelis–Menten equation to give K m values
