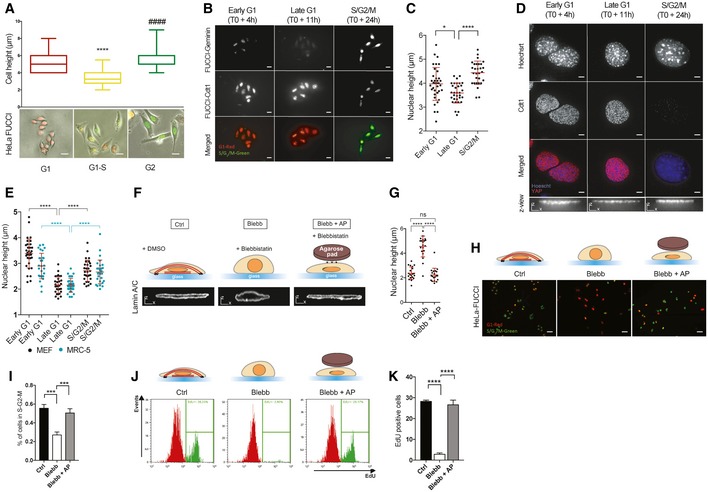
Cell height was measured using AFM for HeLa‐FUCCI in the indicated phase of mitosis. Below: representative images of synchronized HeLa‐FUCCI (box plot, median min/max, n = 20 minimum, ****, ####
P < 0.001 one‐way ANOVA—Tukey's multiple comparisons post‐test, scale bar 15 μm).
Representative images of synchronized HeLa stained with an anti‐geminin to confirm the indicated phase of mitosis (scale bar 15 μm).
Nucleus height was measured by immunofluorescence using Hoechst staining (n = 29 minimum for nucleus height, *P < 0.5, ****P < 0.001 one‐way ANOVA—Tukey's multiple comparisons post‐test).
Representative images of synchronized MEFs stained with an anti‐Cdt1 to confirm the indicated phase of mitosis (scale bar 5 μm, bottom scale bar x = 5 μm z = 5 μm).
Nucleus height of synchronized MEFs (black dot) and synchronized MRC‐5 (blue dot) was measured by immunofluorescence using Hoechst staining. Data are presented as mean ± s.e.m. (n = 29 minimum for nucleus height, ****P < 0.001 one‐way ANOVA—Tukey's multiple comparisons post‐test).
Schematic representation of the method used to induce changes in nuclear shape independently of the actomyosin cytoskeleton. See Fig
EV1 for more details. Briefly, cells are treated with DMSO (Control‐Ctrl), blebbistatin only (Blebb), and blebbistatin whereas an agarose pad (AP) is used to flatten their nuclei and restore a nuclear morphology similar to those of control cells (Blebb + AP). XZ view of representative nuclei (lamin A/C) is shown in these three conditions (scale bar
x = 5 μm
z = 5 μm).
Nucleus height was measured by immunofluorescence using lamin A/C staining. Data are presented as mean ± s.e.m. (n = 20 for nucleus height, ****P < 0.001 one‐way ANOVA—Tukey's multiple comparisons post‐test).
Representative HeLa‐FUCCI cells in S‐G2‐M (green) and G1 phase (red) in Ctrl, Blebb, and Blebb + AP conditions. Scale bar = 31 μm.
Corresponding percentage of HeLa‐FUCCI in mitosis. Data are presented as mean ± s.e.m. (n = 24 fields minimum from four independent experiments, ***P < 0.01 one‐way ANOVA—Tukey's multiple comparisons post‐test).
Representative flow cytometry histograms for EdU‐positive cells in Ctrl, Blebb, and Blebb + AP conditions.
Corresponding percentage of EdU‐positive cells. Data are presented as mean ± s.e.m. (n = 4 independent experiments with at least 60,000 events for each condition per experiment. ****P < 0.001 one‐way ANOVA—Tukey's multiple comparisons post‐test).

