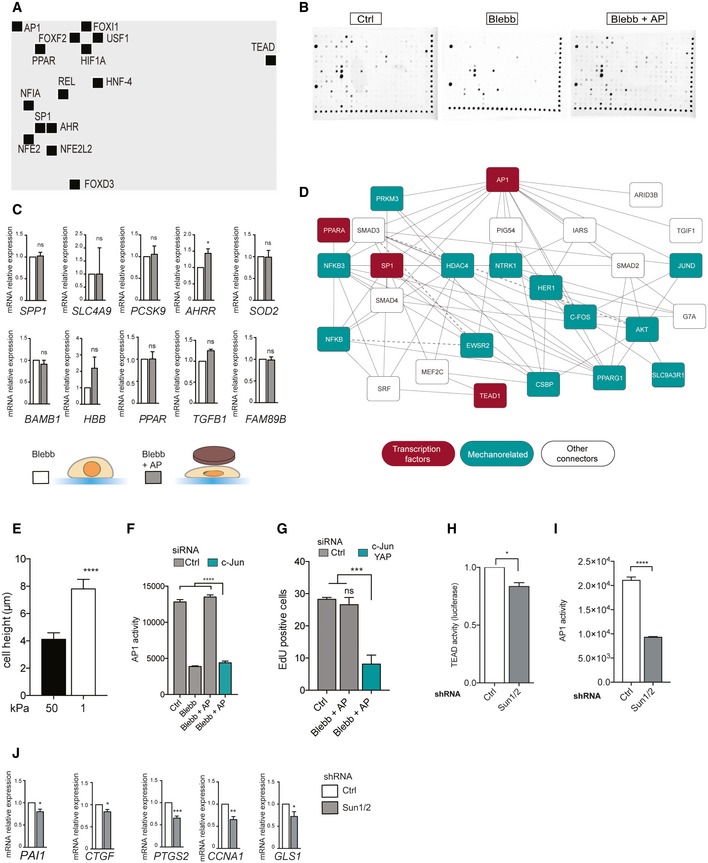
Membrane spot localization of the 15 TFs regulated by nuclear shape.
Raw membranes of Affymetrix protein–DNA combo array kit after exposition to the ChemiDoc (Abcam) apparatus.
mRNA expression for corresponding TF's target genes. Using the TRRUST database, we selected genes known to be positively regulated by these 15 TFs and we analyzed their mRNA expression: SPP1 gene for FOXD3; SLC4A9 gene for FOXI1; PCSK9 gene for HNF‐4; AHRR gene for AHR; SOD2 gene for NFE2L2; BAMB1 gene for FOXF2; HBB gene for NFE2L2; PPAR gene for HIF1A; TGFB1 gene for USF1; and FAM89B gene for NFIA. Only genes with increase in mRNA expression superior to 1.5‐fold change in response to nuclear flattening were selected. Data are presented as mean ± s.e.m. (n = 4 minimum, t‐test *P < 0.5; ns: not significant).
Protein–Protein Interaction Network reconstruction and analysis of the AP1, TEAD, SP1, and PPAR.
Cell height was measured using AFM in cells cultured on soft or stiff matrix. Data are presented as mean ± s.e.m. (n = 15 minimum, ****P < 0.001 t‐test).
AP1 activity was measured in cells depleted or not for c‐Jun in Ctrl, Blebb, and Blebb + AP conditions. Data are presented as mean ± s.e.m. (n = 5, ****P < 0.001 one‐way ANOVA—Tukey's multiple comparisons post‐test)
Percentage of EdU‐positive cells for cells depleted or not for c‐Jun and YAP. Data are presented as mean ± s.e.m. (n = 4 independent experiments with at least 60,000 events for each condition). Data have been generated from two independent experiments using two different siRNAs targeting c‐Jun and YAP. ***P < 0.01 one‐way ANOVA—Tukey's multiple comparisons post‐test.
TEAD activity was analyzed in HeLa cells co‐transfected with a Renilla plasmid as a luciferase reporter plasmid controlled by the TEAD‐responsive promoter, and with a Renilla plasmid as a gene reporter; HeLa cells were depleted or not for SUN1 and SUN2. Data are presented as mean ± s.e.m. (n = 6, t‐test *P < 0.5)
AP1 activity was measured in cells depleted or not for SUN1 and SUN2. Data are presented as mean ± s.e.m. (n = 5, ****P < 0.001 t‐test)
mRNA expression for corresponding TF's target genes for HeLa cells depleted or not for SUN1 and SUN2. Data are presented as mean ± s.e.m. (n = 4, t‐test *P < 0.5; **P < 0.1; ***P < 0.01).

