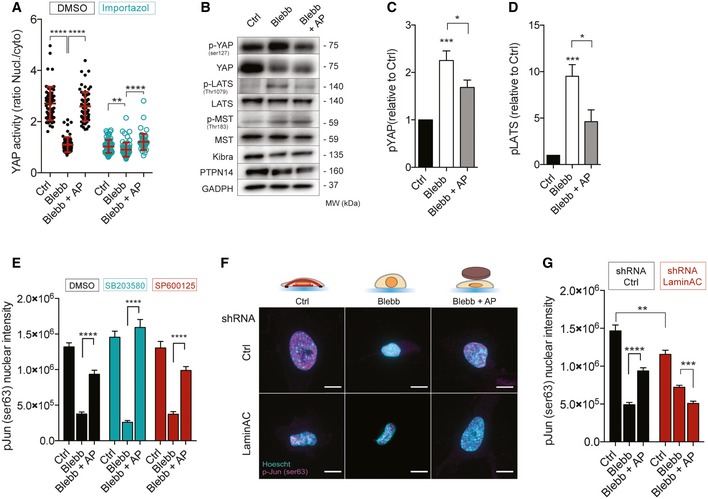
Quantifications of YAP activity in Ctrl, Blebb, and Blebb + AP conditions, treated or not with importazole (nucleo‐cytoplasmic ratio). Data are presented as mean ± s.e.m. (n = 59 minimum from three independent experiments, **P < 0.05, ****P < 0.001 one‐way ANOVA—Tukey's multiple comparisons post‐test).
Immunoblots of p‐YAP (ser127), YAP, p‐LATS (Thr1079), LATS, p‐MST (Thr1083), MST, Kibra, PTPN14, and GADPH for Ctrl, Blebb, and Blebb + AP conditions.
Corresponding quantification of p‐YAP (Ser125) relative to Ctrl and normalized to GAPDH. Data are presented as mean ± s.e.m. (n = 8, *P < 0.5, ***P < 0.01 one‐way ANOVA—Tukey's multiple comparisons post‐test).
Corresponding quantification of p‐LATS (thr1079) relative to Ctrl and normalized to GAPDH. Data are presented as mean ± s.e.m. (n = 6, *P < 0.5, ***P < 0.01 one‐way ANOVA—Tukey's multiple comparisons post‐test).
Quantifications of p‐Jun Ser63 nuclear intensity in Ctrl, Blebb, and Blebb + AP conditions for cells treated with DMSO, SB203580, a MAP Kinase inhibitor, and SP600125, a JNK inhibitor. Data are presented as mean ± s.e.m. (n = 18 minimum, ****P < 0.001 one‐way ANOVA—Tukey's multiple comparisons post‐test.).
Representative cells stained for p‐Jun Ser63 (magenta) and for DNA (cyan) in Ctrl, Blebb, and Blebb + AP conditions for cells depleted or not for lamin A/C. Scale bar = 10 μm.
Corresponding quantification of p‐Jun Ser63 nuclear intensity. Data are presented as mean ± s.e.m. (n = 49 minimum, **P < 0.05, ***P < 0.01, ****P < 0.001 one‐way ANOVA—Tukey's multiple comparisons post‐test).

