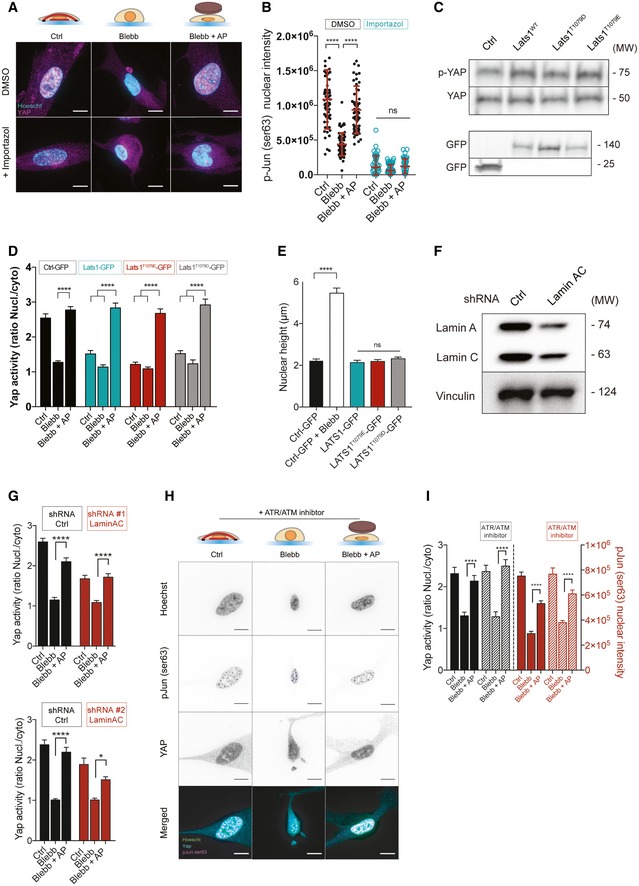
Representative cells stained for p‐Jun Ser63 (magenta) and for DNA (cyan) in Ctrl, Blebb, and Blebb + AP conditions, treated or not with importazole. Scale bar = 10 μm.
Quantifications of p‐ Jun Ser63 nuclear intensity in Ctrl, Blebb, and Blebb + AP conditions, treated or not with importazole. Data are presented as mean ± s.e.m. (n = 44 minimum from two independent experiments, ****P < 0.001 one‐way ANOVA—Tukey's multiple comparisons post‐test).
Immunoblots of p‐YAP (Ser127), YAP, and GFP for HeLa cells transfected with these following plasmids: Ctrl‐GFP, LATS1 WT‐GFP, LATS1T1079E‐GFP, LATS1T1079D‐GFP.
Quantifications of YAP activity (nucleo‐cytoplasmic ratio) in Ctrl, Blebb, and Blebb + AP conditions for cells transfected with GFP, LATS1‐GFP, LATS1T1079E‐GFP, or LATS1T1079D‐GFP. Data are presented as mean ± s.e.m. (n = 18 minimum ****P < 0.001 one‐way ANOVA—Tukey's multiple comparisons post‐test).
Nuclear heights were measured for cells transfected with GFP in Ctrl and Blebb conditions, and for those transfected with LATS1‐GFP, LATS1T1079E‐GFP, LATS1T1079D‐GFP in Ctrl condition. Data are presented as mean ± s.e.m. (n = 18 minimum ****P < 0.001 one‐way ANOVA—Tukey's multiple comparisons post‐test).
Immunoblots of lamin A/C and vinculin for MRC‐5 cells depleted or not for lamin A/C.
Quantification of YAP activity in Ctrl, Blebb, and Blebb + AP conditions for cells depleted or not for lamin A/C. Data are presented as mean ± s.e.m. (n = 48 minimum (TOP), n = 12 minimum (BOTTOM), ****P < 0.001, *P < 0.05 one‐way ANOVA—Tukey's multiple comparisons post‐test).
Representative cells stained for p‐Jun Ser63 (magenta), for YAP (cyan), and for DNA (green) treated with ATR/ATM inhibitor. Scale bar = 10 μm.
Quantifications of p‐Jun Ser63 nuclear intensity in Ctrl, Blebb, and Blebb + AP conditions for cells treated with an ATR/ATM inhibitor. Data are presented as mean ± s.e.m. (n = 30, ****P < 0.001 one‐way ANOVA—Tukey's multiple comparisons post‐test.).

