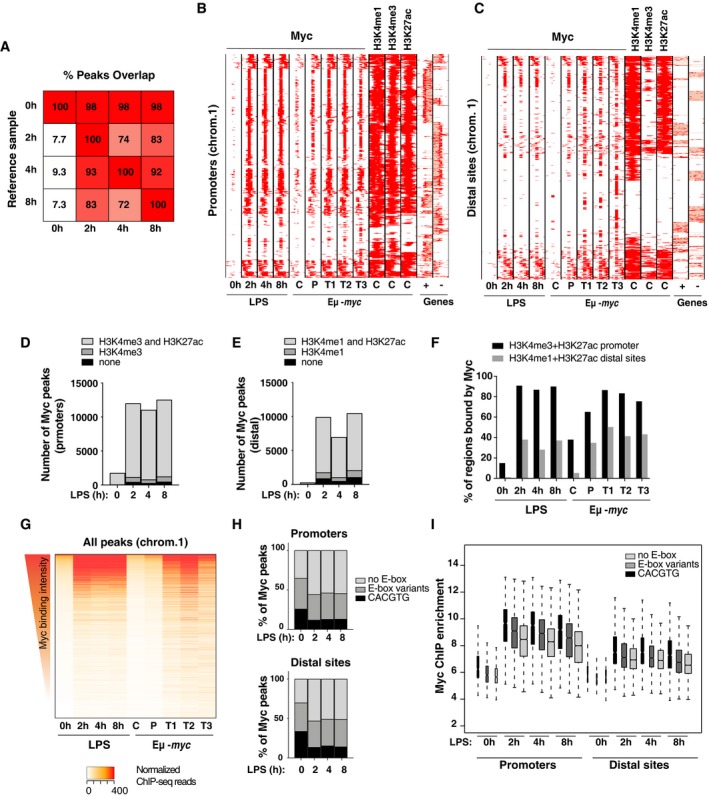
Figure 2. Myc widely associates with active promoters and enhancers upon LPS stimulation.

-
AOverlap between Myc ChIP‐Seq peaks. For each time‐point indicated at the bottom, the percentage of peaks overlapping over ≥ 1 bp with any other time‐point (Reference sample) is reported. Peaks showed consistent distributions along the time‐course, almost all those called in untreated cells being included in LPS‐stimulated samples
-
B, CDistribution of Myc at promoters (B) and distal sited (C) in LPS‐treated B‐cells (0, 2, 4 8 h) and in B‐cells in vivo, in either control c‐myc wt/wt (C), pre‐tumoral Eμ‐myc mice (P), or tumors (T) 4. Each row represents a promoter‐associated Myc peak within a 6‐kb genomic interval (centered on the midpoint of the peak). The heatmap includes every annotated promoter in chromosome 1 (as representative of the whole genome) that was called as Myc‐associated by ChIP‐Seq in at least one sample. For the same intervals, we also show the distribution of H3K4me1, H3K4me3, and H3K27ac in the in vivo control sample, and gene annotations (exons in red, introns in pink; + sense, − antisense strand).
-
D, ENumbers of Myc peaks at promoters (−2 kb, +1 kb) (D) and distal sites (E) at different time‐points after LPS stimulation. The shadings mark the subsets of peaks associated with H3K4me3 (D) or H3K4me1 (E), with or without H3K27ac.
-
FPercentage of active promoters (positive for H3K4me3 and H3K27ac) or distal sites (H3K4me1 and H3K27ac) that overlap with at least a Myc peak at the different time‐points after LPS stimulation (0, 2, 4, 8 h) or in vivo (C, P, T1, T2, T3).
-
GQuantitative heatmap showing Myc signal intensities (read counts normalized by library size) at each bound region in chromosome 1, ranked based on the signal in the control sample (0 h LPS).
- H
-
IMyc enrichment by ChIP‐Seq at different time‐points after LPS treatment for peaks located either in promoters or distal sites and containing the indicated DNA motifs. In the boxplot, the central tendency marks the median, the box ranges mark the upper and lower quartiles, and the whiskers extend to the upper and lower extreme datapoints, which are no more than 1.5 times the interquartile range from the box. The Myc ChIP‐Seq time‐course was performed on a unique pool of cells, obtained from > 10 mice.
