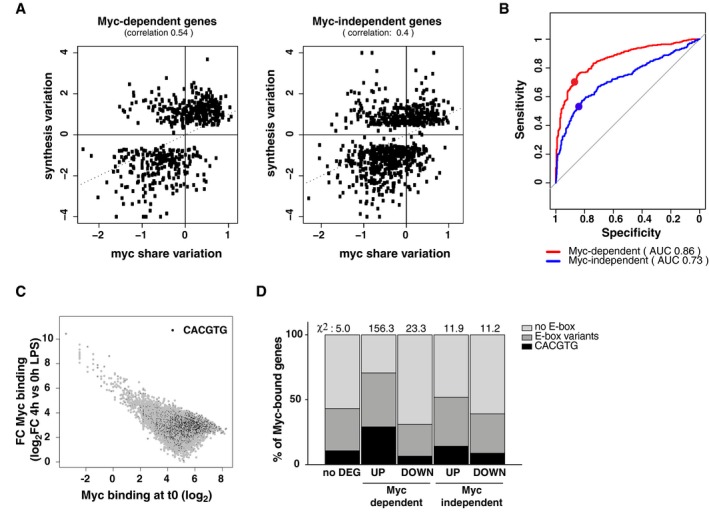
Scatter plots correlating the variations in Myc share at promoters (averaged between the 2‐, 4‐, and 8‐h time‐points) and in RNA synthesis (at 8 h), relative to untreated cells, for Myc‐dependent and Myc‐independent genes. The Spearman correlation between the two parameters is reported.
The ability of the Myc share in predicting the transcriptional outcome can be represented in terms of a receiver operating characteristic (ROC) curve, which represents the Sensitivity (true‐positive rate) and Specificity (true‐negative rate) of a predictor (i.e., Myc share) in discriminating between two classes (i.e., up‐ and down‐regulated genes), using different thresholds. The largest the area under the curve (AUC), the largest is the predictive power, in a scale from 0.5 (random classification: gray line) to 1 (perfect predictor). For each system, the dot corresponds to the variation of Myc at which promoters begin increasing their share of Myc binding.
Fold‐change in Myc levels at each bound promoter (at 4 h LPS, relative to time zero) as a function of the initial binding intensity at time zero (expressed as log2 of the coverage in a 200‐bp window around the summit of the peak). Peaks containing a canonical E‐box are highlighted in black.
Percentage of Myc‐bound promoters within the indicated transcriptionally regulatory categories that contains a canonical or variant E‐box. The overall chi‐square is 207.7 with a P‐value < 0.00001. The contribution to the chi‐square of each category is reported above the corresponding bar in the plot.

