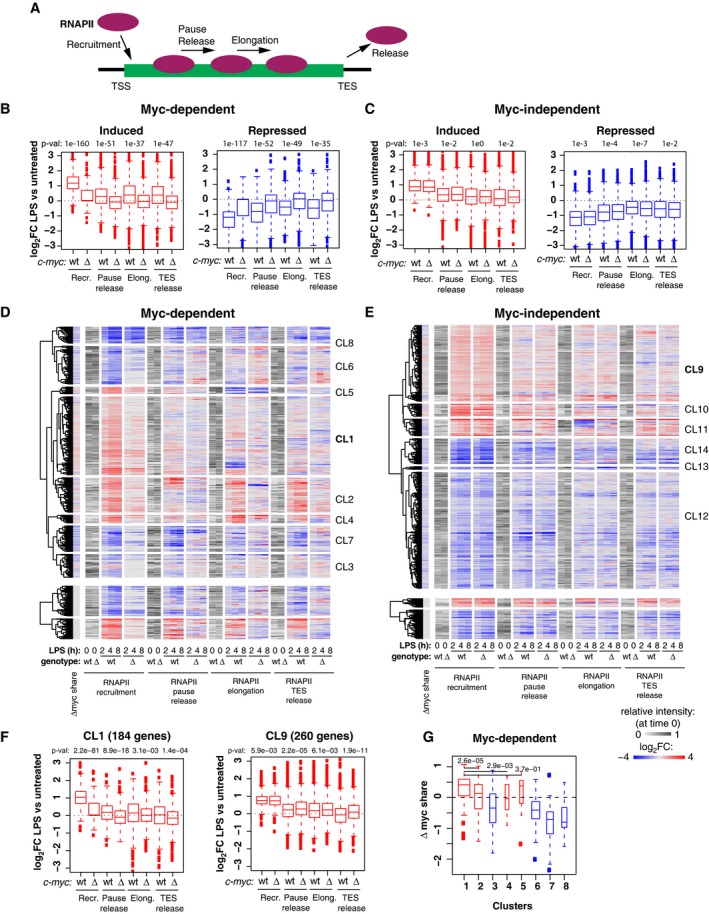
Figure 4. Myc regulates all steps of the RNAPII transcriptional cycle.

-
AScheme of the different steps of RNAPII regulation for which the corresponding rates were modeled 34.
-
B, CBoxplots reporting LPS‐induced changes (log2FC) for each of the four RNAPII kinetic rates in c‐myc wt/wt (wt) and c‐myc ∆/∆ cells for Myc‐dependent (B) and Myc‐independent (C) induced and repressed genes. P‐values obtained with two‐sample Wilcoxon tests for the comparison between c‐myc wt/wt and c‐myc ∆/∆ cells are reported. The RNAPII ChIP‐Seq time‐course was performed on two biological replicates (each on pools of cells from > 10 mice), and reads were merged after sequencing. All boxplots are as defined in Fig 2I.
-
D, EHeatmaps showing the variations in RNAPII kinetic rates (log2FC) on Myc‐dependent (D) and Myc‐independent (E) genes during the LPS time‐course. The gray scale represents the starting level for each parameter in unstimulated cells. The first column on the left reports the changes in Myc share for the same genes. Genes were grouped using hierarchical clustering.
-
FBoxplots reporting LPS‐induced changes (log2FC) for each of the four RNAPII kinetic rates in c‐myc wt/wt (wt) and c‐myc ∆/∆ cells for genes of clusters 1 and 9. P‐values obtained with two‐sample Wilcoxon tests for the comparison between c‐myc wt/wt and c‐myc ∆/∆ cells are reported.
-
GChanges in Myc share in LPS‐treated versus LPS‐untreated cells for the different clusters of panel d. P‐values obtained with two‐sample Wilcoxon tests for the comparison between c‐myc wt/wt and c‐myc ∆/∆ cells are reported.
