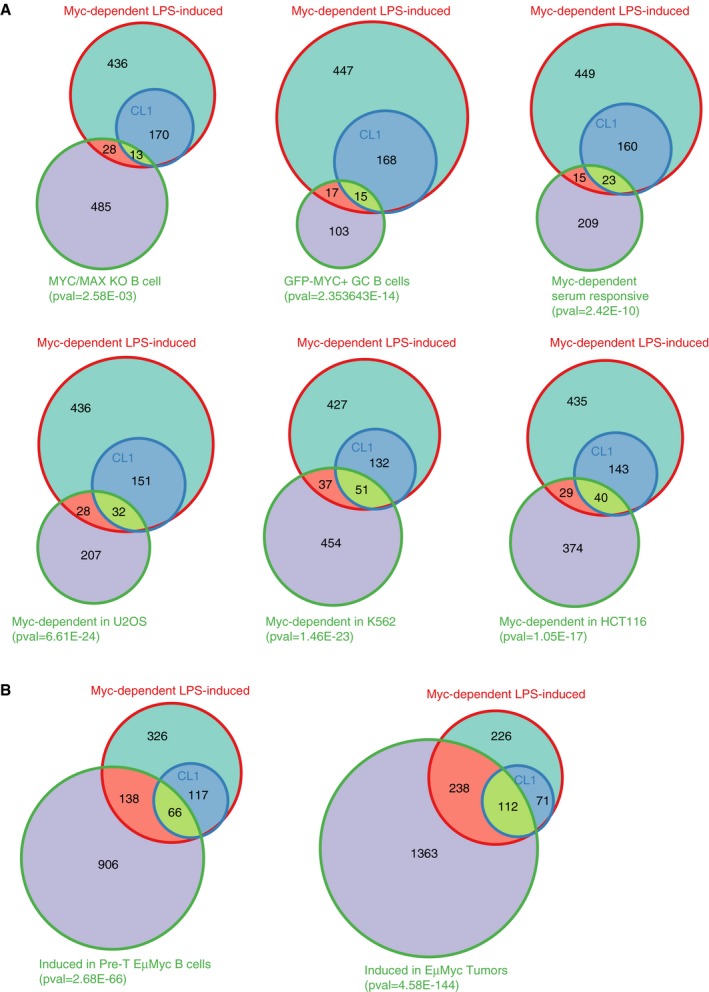
Venn diagrams representing the overlap between Myc‐dependent LPS‐induced genes defined in this study (either all genes, or only those in CL1) with other lists of Myc‐regulated genes. From left to right, and top to bottom: genes less expressed in Myc/Max KO B‐cells activated with LPS for 72 h, compared to wt cells
16; genes more expressed in Myc‐positive versus negative germinal center B‐cells
10 Myc‐dependent serum‐responsive (MDSR) genes in fibroblasts
8; genes down‐regulated in Myc‐depleted U2OS
29, K562 and HCT116 cells
31.

