-
A, B
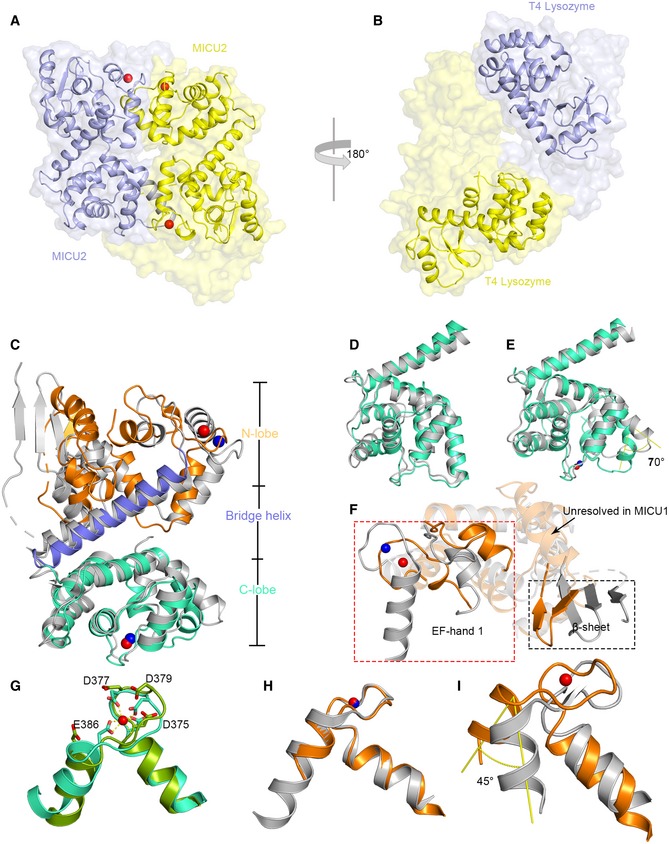
Space filling and cartoon representation of two MICU2 (A) and T4L molecules (B). The protein chain with two calcium ions bound is colored in yellow, and the protein chain with one calcium ion bound is colored in purple. Calcium ions are shown as red spheres.
-
C
The structure of Ca2+‐bound MICU2 (molecule 2) is superimposed with Ca2+‐bound MICU1 (PDB code: 4NSD). MICU1 is colored in gray; MICU2 is colored in orange, marine, and green‐cyan for different domains. Calcium ions are shown as blue and red spheres in MICU1 and MICU2, respectively.
-
D, E
Comparison of C‐lobes of MICU2 (green‐cyan) and MICU1 (gray) in the Ca2+‐free (D) and Ca2+‐bound (E) states.
-
F
Comparison of N‐lobes of MICU1 (gray) and MICU2 (orange) shows large divergence in the EF‐hand 1 (box in red dotted line) and β‐sheet (box in black dotted line). Calcium ions are shown as blue and red spheres in MICU1 and MICU2, respectively.
-
G
Superimposition of MICU2 EF‐hand 2 in Ca2+‐bound (green‐cyan) form and Ca2+‐free form (bright green). Calcium ion is shown as a red sphere.
-
H
Superimposition of MICU2 EF‐hand 1(with Ca2+‐bound) and MICU1 Ca2+‐bound EF‐hand 1. Calcium ions are shown as blue and red spheres in MICU1 and MICU2, respectively.
-
I
Superimposition of MICU2 EF‐hand 1 (with Ca2+‐bound) and MICU1 Ca2+‐free EF‐hand 1. The angle (yellow) represents the conformational difference. The calcium ion in MICU2 is shown as a red sphere.

