-
A
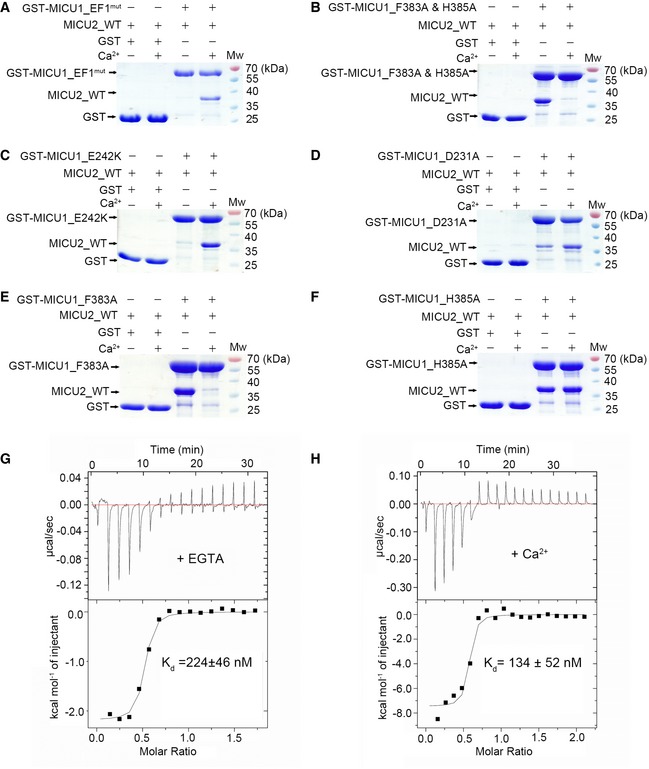
GST‐MICU1_EF1mut failed to pull down MICU2_WT in the absence of 2 mM Ca2+, whereas they displayed a strong interaction in the presence of 2 mM Ca2+.
-
B
GST‐MICU1_F383A & H385A failed to pull down MICU2_WT in the presence of Ca2+, whereas they displayed a strong interaction in the absence of 2 mM Ca2+.
-
C
GST‐MICU1_E242K failed to pull down MICU2_WT in the absence of Ca2+, whereas they displayed a strong interaction in the presence of 2 mM Ca2+.
-
D
GST‐MICU1_D231A partly pulled down MICU2_WT in the absence of Ca2+, whereas they displayed a strong interaction in the presence of 2 mM Ca2+.
-
E
GST‐MICU1_F383A failed to pull down MICU2_WT in the presence of Ca2+, whereas they displayed a strong interaction in the absence of 2 mM Ca2+.
-
F
GST‐MICU1_H385A exhibited a strong interaction with MICU2 in both the absence and presence of 2 mM Ca2+.
-
G, H
ITC analyses of MICU1 and MICU2 binding properties in the presence of 2 mM EGTA (G) and CaCl2 (H).

