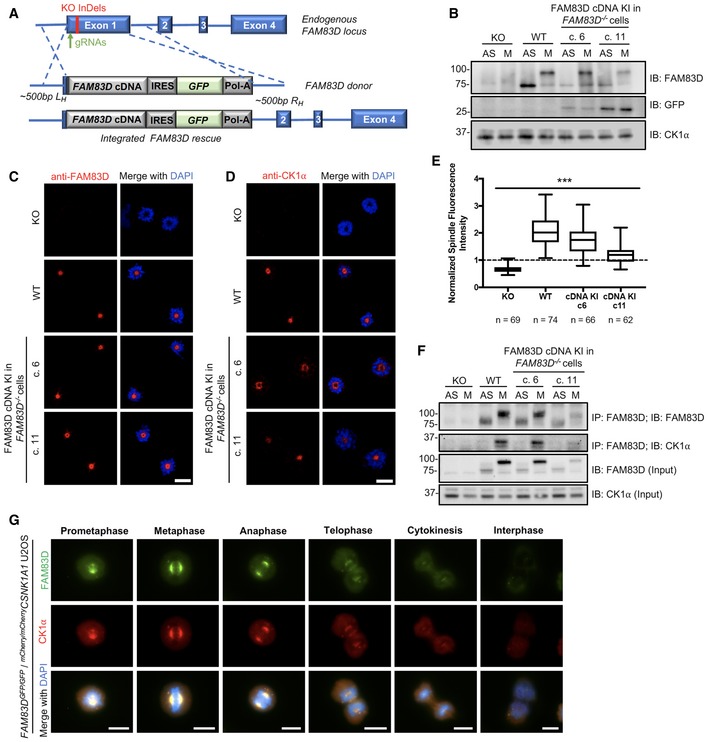
Figure 3. Reinstating FAM83D at the endogenous locus in FAM83D knockout cells.

-
ASchematic illustrating the CRISPR‐based strategy used to reintroduce FAM83D into the FAM83D −/− knockout background.
-
BFAM83D −/− (KO), wild‐type (WT) and two independent clones from a CRISPR/Cas9‐mediated knockin rescue of FAM83D cDNA into FAM83D −/− cells (c. 6 and c. 11) were synchronised in mitosis (M) with STLC. Asynchronous (AS) cells were included as a control. Cells were lysed and subjected to immunoblotting (IB) with the indicated antibodies.
-
C, DThe cell lines described in (B) were STLC‐synchronised in mitosis, fixed and stained with antibodies recognising FAM83D (C) or CK1α (D). Representative images of mitotic cells are included. Scale bars, 20 μm.
-
EQuantification of CK1α spindle localisation for the experiment described in (D) using the same strategy employed in Fig 2C. Box plot whiskers denote the minimum and maximum measured values. The middle line represents the median, and the box ranges depict the 25th/75th percentiles. ***P < 0.0001; ANOVA. Analysis was performed on the indicated number of cells, n = 1.
-
FThe cell lines described in (B) were STLC‐synchronised in mitosis (M) or left AS, lysed and subjected to immunoprecipitation (IP) with anti‐FAM83D‐coupled sepharose beads, before IB with the indicated antibodies.
-
GAsynchronous (AS) FAM83D GFP/GFP/mCherry/mCherry CSNK1A1 knockin U2OS cells were fixed and imaged. Representative images from the indicated cell cycle stages are included. Scale bars, 10 μm. All blots are representative of at least three independent experiments.
