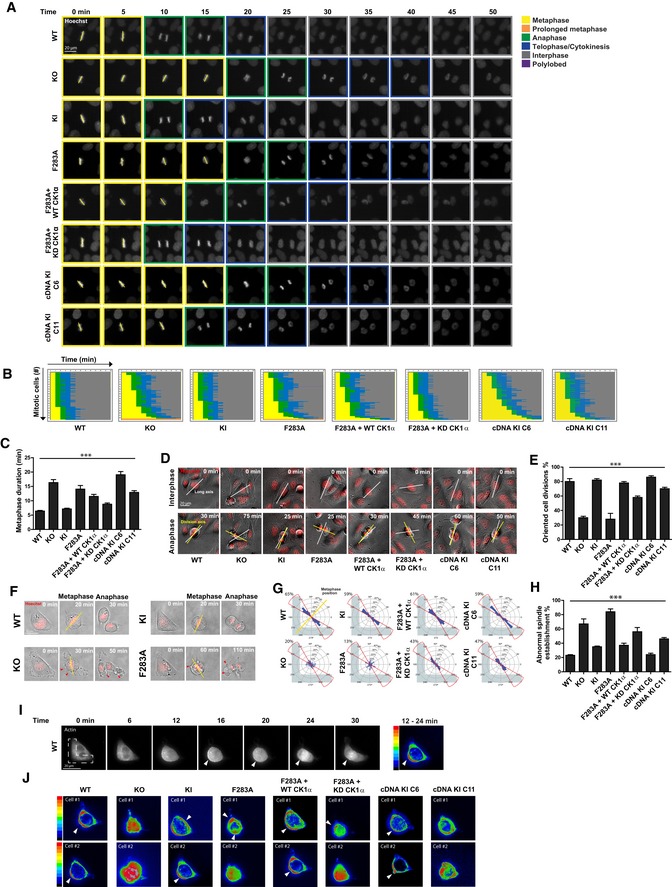
Representative images initiating at metaphase for mitotic U2OS cell lines stained with Hoechst, taken every 5 min as they progress through division. Mitotic stage was determined by chromosome condensation and is indicated by the coloured boxes. Scale bar, 20 μm.
Graphical representation for the kinetics of transition from metaphase alignment (yellow) to anaphase (green), and cytokinesis (blue). 100 mitotic cells per genotype are plotted; n = 2.
Length of time needed to transition from metaphase to anaphase. Mean of 100 mitotic cells per genotype are plotted; n = 2. Error bars, SEM. ***P < 0.0001; ANOVA.
Representative bright‐field images for mitotic U2OS cells indicating the long axis during interphase (white line) preceding mitosis, and the division axis determined at anaphase (yellow line). Scale bar, 20 μm.
Percentage of oriented divisions for U2OS cells grown in subconfluent cultures. An oriented division axis was defined as being < 30° removed from the long axis of the interphase cell. Mean of 50 cells per genotype are plotted, n = 2. Error bars, SEM. ***P < 0.0001; ANOVA.
Representative images of mitotic U2OS cells stained with Hoechst and grown on L‐shaped micropatterns previously coated with fibronectin. The position of metaphase chromosomes, which is plotted in panel (H), is indicated (yellow line) as is the presence of cortical blebbing (red arrows). Scale bar, 20 μm.
Circular graphs, superimposed on L‐shaped micropattern, show the distribution of cell division angles measured at anaphase. Angles for 100 U2OS cells are plotted per genotype, n = 2. Metaphase position is indicated (yellow line), and the percentages of division angles ± 15° from the expected axis (red line) are indicated.
Percentage of metaphase U2OS cells that align chromosomes outside of the expected axis (angles ± 15°). Mean of 100 cells per genotype are plotted, n = 2. Error bars, SEM. ***P < 0.0001; ANOVA.
Representative images of RFP‐actin localisation in mitotic U2OS cells grown on fibronectin‐coated, L‐shaped micropatterns, which is superimposed. Arrowheads indicate polarised cortical actin. Heatmap shows the intensity of RFP‐actin localisation (ImageJ z‐projection standard deviation) as the cell progresses from prophase to metaphase (12–24 min). Scale bar, 20 μm.
Heatmap additive intensities of RFP‐actin localisation in two representative mitotic U2OS cells for each genotype grown on fibronectin‐coated, L‐shaped micropatterns. Arrowheads indicate polarised cortical actin.

