
Figure 2. R loop accumulation after depletion of the selected DNA Damage Checkpoint (DDC) and Post‐replicative Repair (PRR) candidates.
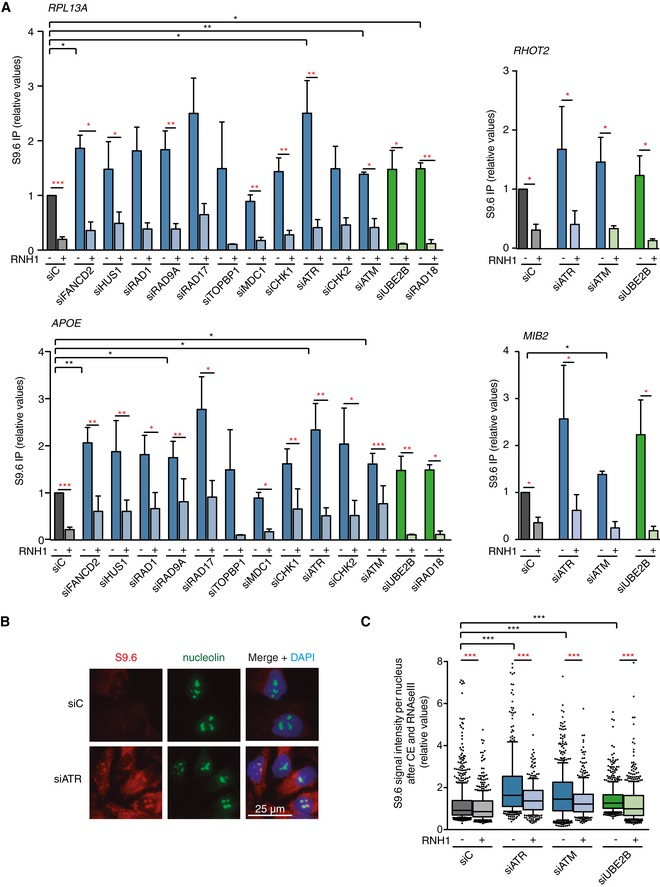
- Relative DRIP–qPCR signal values at RPL13A, APOE, MIB2, and RHOT2 genes in HeLa cells transfected with the indicated siRNAs and treated in vitro with RNase H pre‐immunoprecipitation where indicated. The mean ± SEM from at least three independent experiments is shown. *P < 0.05, **P < 0.01, ***P < 0.001 (one‐tailed paired t‐test).
- Representative images of immunostaining with S9.6 and anti‐nucleolin antibodies in HeLa cells transfected with the indicated siRNAs.
- Relative S9.6 signal intensity per nucleus after nucleolus signal removal in HeLa cells after cytoplasm pre‐extraction (CE) and treated in vitro with RNase III and RNase H where indicated. More than 500 total cells from three independent experiments were considered. The median of each population is shown. Boxes and whiskers indicate 25–75 and 10–90 percentiles, respectively. ***P < 0.001 (Mann–Whitney U‐test).