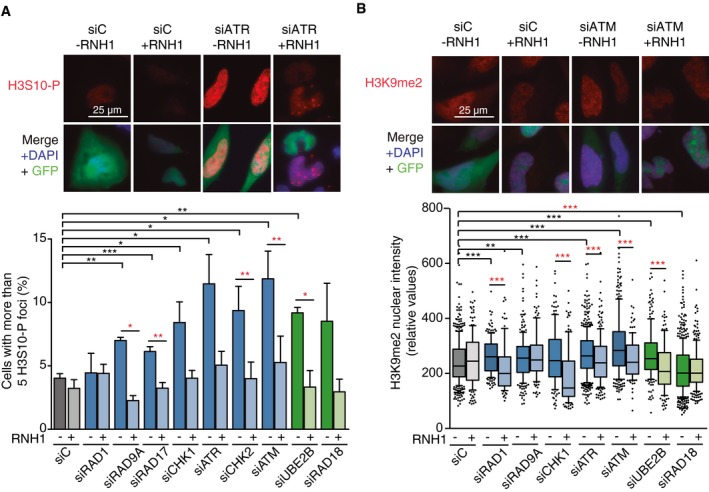
Representative images and percentage of HeLa cells with more than 5 H3S10‐P foci after transfection with the indicated siRNAs and either pEGFP‐C1 (RNH1−) or pEGFP‐M27 (RNH1+). Mitotic cells were excluded for the analysis by DAPI staining. More than 300 total cells were considered. Data represent mean ± SEM from three independent experiments.
Representative images and H3K9me2 nuclear signal intensity of HeLa cells transfected with the indicated siRNAs and either pEGFP‐C1 (RNH1−) or pEGFP‐M27 (RNH1+). At least three experiments were performed. The median of each population in a representative experiment with at least 100 cells per condition is shown. Boxes and whiskers indicate 25–75 and 10–90 percentiles, respectively.
Data information: *
P < 0.05, **
P < 0.01, ***
P < 0.001 (one‐tailed paired
t‐test). Black stars denote significant increases, whereas red stars denote significant decreases.

