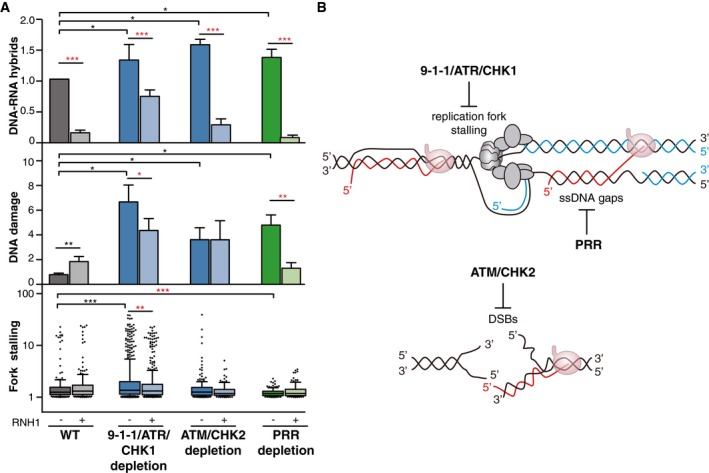
DNA–RNA hybrids, DNA damage, and fork stalling in 9‐1‐1/ATR/CHK1, ATM/CHK2, and PRR‐deficient cells. DNA–RNA hybrids represent the mean ± SEM of all the DRIP data from Fig
2A. ***
P < 0.001, *
P < 0.05 (paired
t‐test). DNA damage represents the mean of medians ± SEM of all the comet tail moment data from Fig
3B. **
P < 0.01, *
P < 0.05 (paired
t‐test). Fork stalling represents the median, 25–75 (boxes) and 10–90 percentiles (whiskers) of all the fork asymmetry data from Fig
5B. ***
P < 0.001, **
P < 0.01 (Mann–Whitney
U‐test). Black stars denote significant increases, whereas red stars denote significant decreases.

