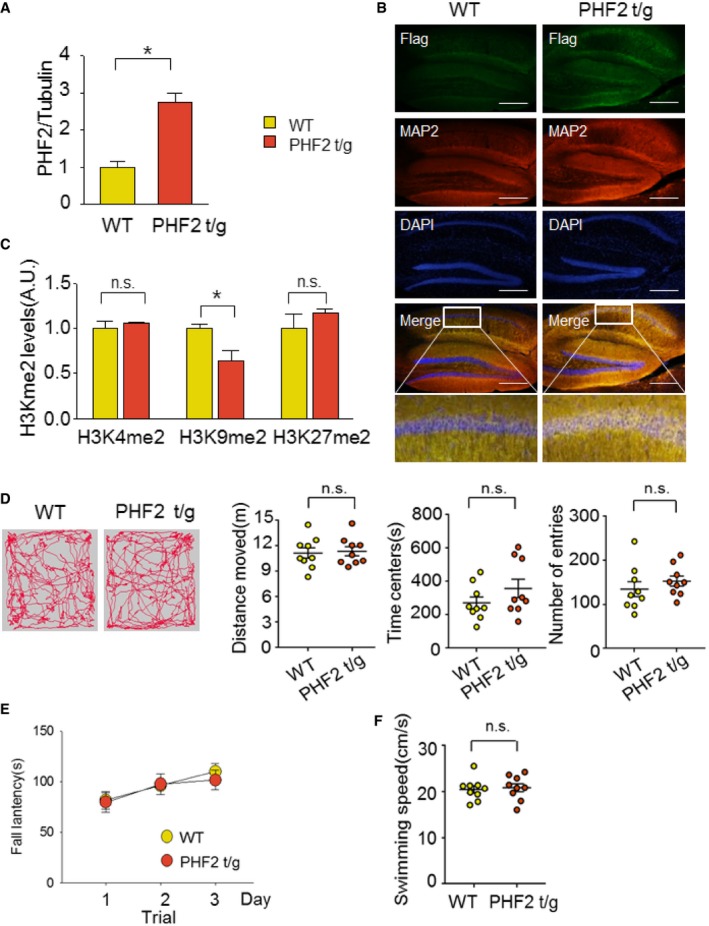
Quantification of the immunoblot analysis. PHF2 protein levels of PHF2 t/g mice were normalized against tubulin and quantified as fold change relative to that seen in WT littermate mice.
Immunofluorescence of hippocampal coronal sections of WT littermate and Flag‐PHF2 t/g mice stained with Flag (green), MAP2 (red), and DAPI (blue). Ectopic expression of Flag‐PHF2 in the CA1 region of the hippocampus of PHF2 t/g compared to WT littermate mice. Scale bar, 200 μm.
H3Kme2 protein levels in PHF2 t/g mice were normalized against H3 and quantified as fold change relative to levels in WT mice.
Path traces of single‐trial open field tests for WT littermate and PHF2 t/g mice (left). No differences in distance moved, time spent in the center, or number of entries to the center area were observed between the two groups (right).
No difference in rotarod motor activity was observed between WT littermate and PHF2 t/g mice.
No difference in swimming ability was observed between WT littermate and PHF2 t/g mice.
Data information: In (A, C), data are presented as the mean ± SD (
n = 6). *
P < 0.05 (unpaired, two‐sided Student's
t‐test). In (D–F), data are presented as the mean values ± SEM (
n = 9). Data were analyzed using unpaired, two‐sided Student's
t‐test.

