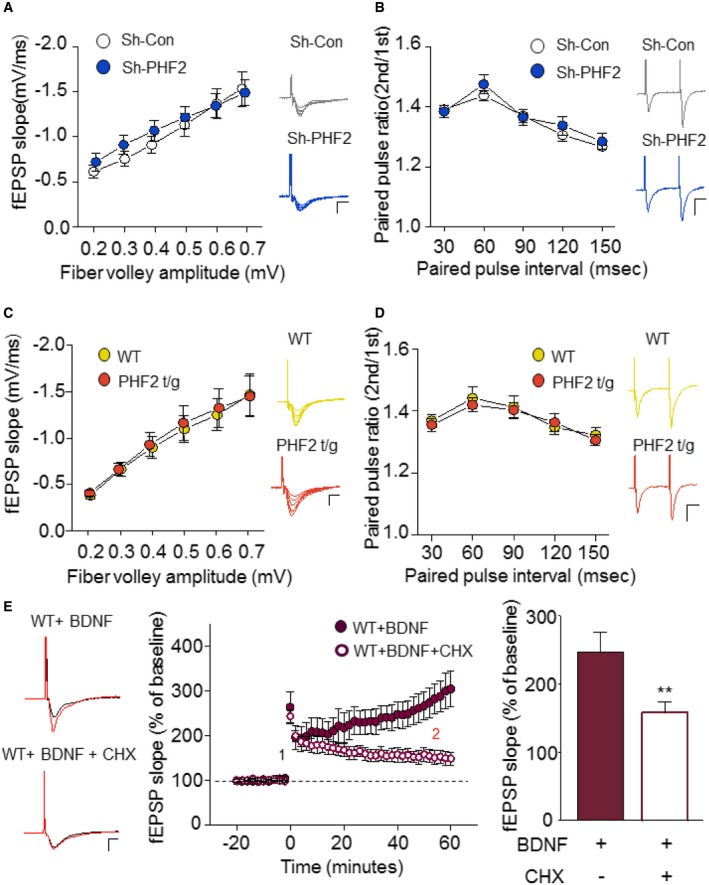
Input–output of the SC‐CA1 synapse of sh‐Con or sh‐PHF2 expressing mice is represented by fiber volley and fEPSP slope, respectively. Each point represents a mean for a narrow range of fiber volley amplitudes. Representative raw traces are shown for each fiber volley amplitude. Scale bar, 1 mV/5 ms.
Relationship of PPR of the SC‐CA1 synapses in the hippocampus of sh‐Con (white) and sh‐PHF2 (blue) mice. Example raw traces for PPR are shown for 60‐ms intervals. Scale bar: 1 mV/20 ms.
SC‐CA1 synapses of WT and PHF2 t/g mice show no differences in input–output relationship. Representative raw traces are shown for each fiber volley amplitude. Scale bar, 1 mV/5 ms.
PPR is shown for PHF2 t/g mice in comparison with WT mice. Example raw traces for PPR are shown for 60‐ms intervals. Scale bar: 1 mV/20 ms.
WT hippocampal slices were pre‐incubated with BDNF (20 ng/ml) for > 1 h before HFS induction. BDNF‐HFS‐induced LTP enhancement was blocked by simultaneous application of CHX (60 μM). Example traces of baseline (1: black) and 40 min after LTP induction (2: red) are shown for BDNF‐treated and BDNF + CHX‐treated WT hippocampal slices (Middle). Scale bar, 1 mV/5 ms. Comparison of LTP at 40 min post‐HFS induction (right).
Data information: In (A–E), data are presented as the mean values ± SEM (sh‐Con,
n = 8; sh‐PHF2,
n = 6; WT,
n = 11; PHF2 t/g,
n = 12, BDNF on WT slices,
n = 8; BDNF+CHX on WT slices,
n = 6). **
P < 0.01 (unpaired, two‐sided Student's
t‐test).

