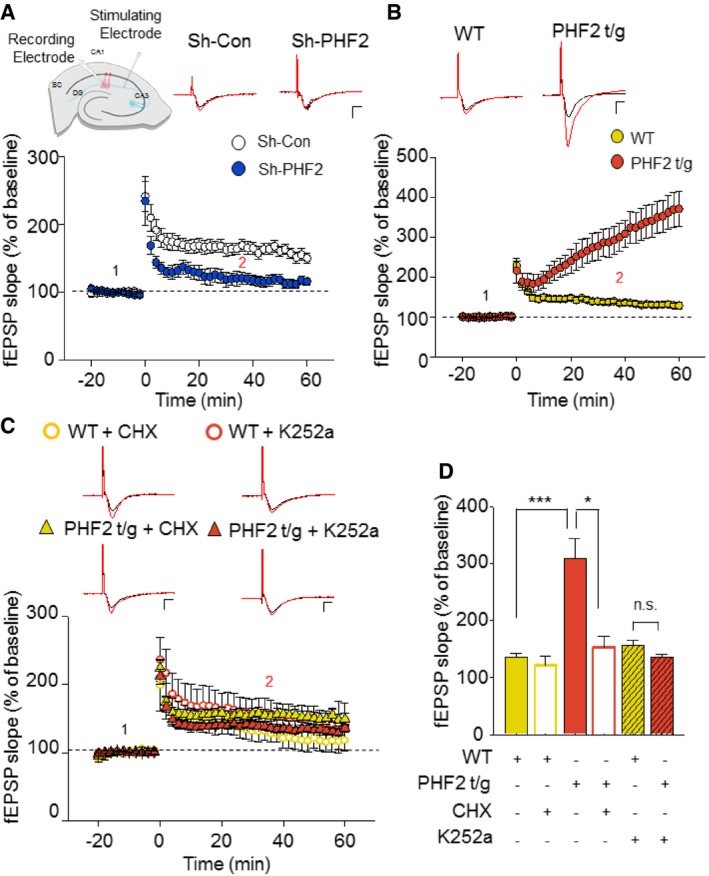
LTP fEPSP recordings of sh‐Con (white) and sh‐PHF2 (blue) hippocampal slices induced by 100 Hz HFS showed impaired LTP in sh‐PHF2 mice relative to sh‐Con mice. Representative baseline (1: black) and 40 min post‐HFS (2: red) raw fEPSP traces of sh‐Con and sh‐PHF2 (right). Scale bar: 1 mV/5 ms.
LTP fEPSP recordings from WT (yellow) and PHF2 t/g (orange) hippocampal slices. PHF2 t/g mice produced an enhanced potentiation after HFS. Representative raw traces (right) of WT and PHF2 t/g during baseline (1: black) and 40 min post‐HFS (2: red). Scale bar, 1 mV/5 ms.
Bath application (10 min pre‐incubation prior to baseline recording) of a protein synthesis blocker, CHX (60 μM) on PHF2 t/g slices (yellow triangles, n = 5), significantly blocked the enhancement of LTP but had no effect on WT slices (open yellow, n = 5). Pre‐incubation with K252a (200 nM), a TrkB inhibitor, 10 min prior to baseline recordings, also inhibited the enhancement of LTP in PHF2 t/g hippocampal slices (orange triangle, n = 15). K252a showed no effect on WT slices (open orange circle, n = 10). Representative raw traces of WT and PHF2 t/g during baseline (1: black) and 40 min post‐HFS (2: red) under the influence of CHX or K252a. Scale bars, 1 mV/5 ms.
Comparison of LTP at 40 min post‐HFS induction.
Data information: In (A–D), data are presented as the mean values ± SEM (sh‐Con,
n = 8; sh‐PHF2,
n = 6; wild type,
n = 11; PHF2 t/g,
n = 12, WT slices,
n = 10; PHF2 t/g slices,
n = 15; CHX on PHF2 t/g slices,
n = 15; K252a on WT slices,
n = 10). ***
P < 0.001, *
P < 0.05 (unpaired, two‐sided Student's
t‐test).

