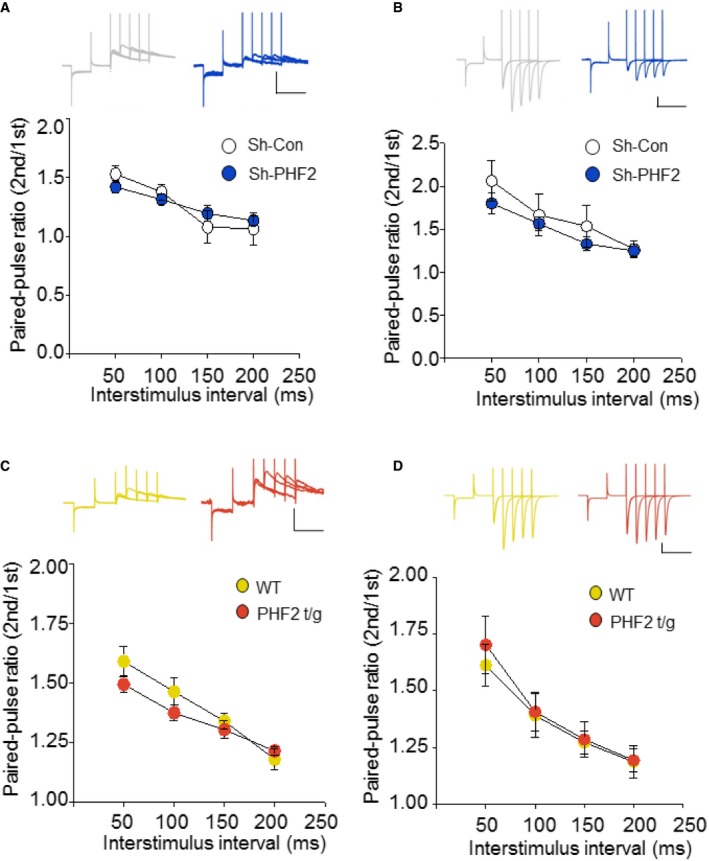
Figure EV5. Basal synaptic transmission of NMDA‐ and AMPA‐mediated EPSCs do not differ by PHF2 expression levels.

-
A, BRecording of NMDAR‐ (A) and AMPAR‐mediated (B) PPR at 50, 100, 150, and 200 ms intervals. Insets indicate raw trace of PPR (Top). Scale bars, 100 pA/150 ms.
-
C, DRecording of NMDAR‐ (C) and AMPAR‐mediated (D) PPR at 50, 100, 150, and 200 ms intervals. Insets indicate raw trace of PPR (Top). Scale bars, 100 pA/150 ms.
