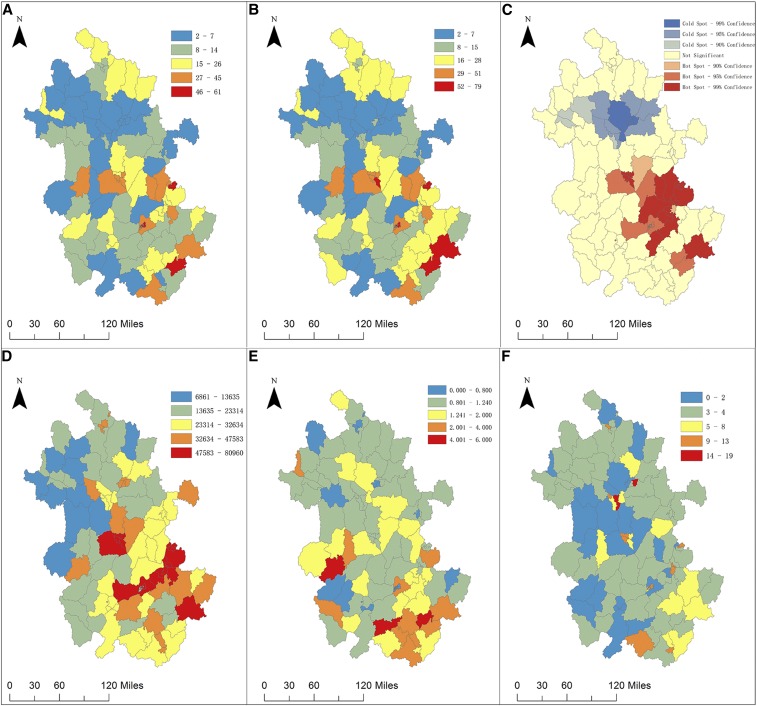
Figure 1.
Maps of county-level infectious diarrhea incidence and socioeconomic factors in 105 counties in the Anhui Province of China. (A): Crude incidence rate (1/10,000), (B): age-adjusted incidence rate (1/10,000), (C): hot and cold spots, (D): per capita GDP (RMB, ¥), (E): number of public health physicians per 10,000 persons, (F): number of medical staffs per 1,000 persons. This figure appears in color at www.ajtmh.org.

