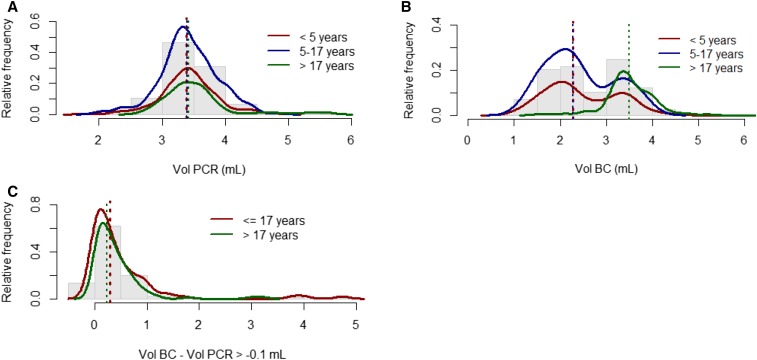
Figure 1.
Analysis of the sample volumes used for culture and polymerase chain reaction (PCR) clustered by patient age. Histograms (gray bars) show relative frequency in volumes, and lines are the related tendency curve for the respective age groups. A and B represent distribution of collected volumes used for either PCR or culture. Red, blue, and green lines indicate the population of patients aged ≤ 5 years, 5–17 years, and older, respectively. The corresponding colored dash lines indicate the median volume used for testing. Whereas they all appear superimposed on A, only under 5 and 5–17 years old age groups are similar in B. C shows the distribution of samples with a volume difference between culture and PCR ≥ -0.1 mL. Red line is the related tendency curve for the ≤ 17 years age group (green for adults), and the corresponding colored dash lines indicate the median difference in volume by cluster of age. BC = blood culture; Vol = volume.

