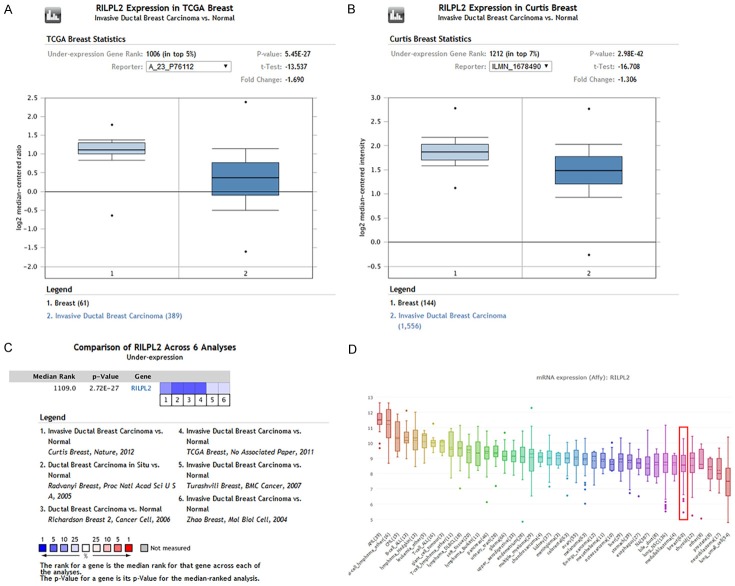
Figure 1.
Analysis of RILPL2 mRNA expression in breast cancer. Boxed plots from the ONCOMINE database were used to compare the expression of RIPL2 mRNA in normal tissues and BC tissues. The p value was set to 0.01. A. RILPL2 mRNA expression from TCGA database. B. RILPL2 mRNA expression from Curtis database. C. Meta-analysis of gene expression profiling for RILPL2 in BC using ONCOMINE, with P < 0.05 and fold change > 1.5. The colored squares indicate the median rank for RILPL2 across each analysis comparing BC with normal tissue. D. CCLE analysis showed that the expression level of RILPL2 mRNA was lower in BC cell lines (shown in red frame).

