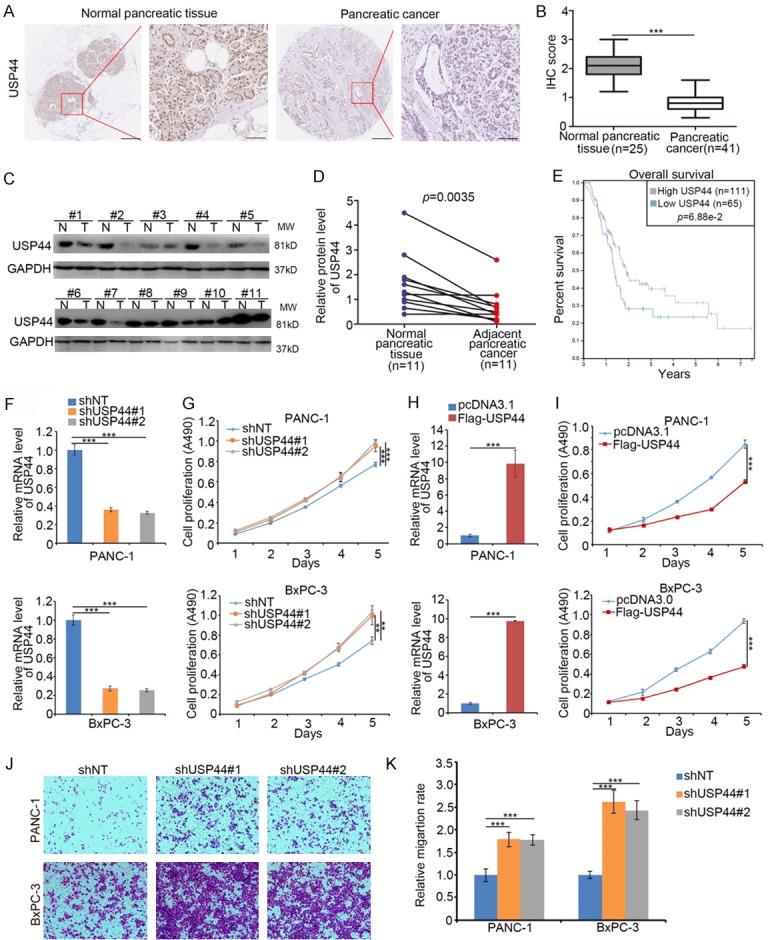
Figure 1.

USP44 inhibits pancreatic cancer progression. (A and B) Tissue microarray specimens were stained with USP44, the IHC image (A) and the IHC score of USP44 (B) are shown. ***P < 0.001. (C and D) 11 paired pancreatic adenocarcinoma tissues (T) and the adjacent non-tumor tissues (N) was subjected to Western blot analysis (C). USP44 expression levels were quantified by using Image J software. P = 0.0035. (E) The overall survival rate of PDAC patients was determined by the Human Protein Atlas. The P valued was shown. (F and G) BxPC-3 and PANC-1 cells were infected with indicated constructs for 48 h. The cells underwent RT-qPCR analysis (F) and MTS assay (G). Data are presented as the mean values ± SD (n = 3). ***P < 0.001. (H and I) BxPC-3 and PANC-1 cells were transfected with indicated plasmids for 48 h. The cells were sent for RT-qPCR analysis (H) and MTS assay (I). Data are presented as the mean values ± SD from 3 replicates. ***P < 0.001. (J and K) BxPC-3 and PANC-1 cells were infected with indicated shRNA. 48 h post-infection, the cells were collected for the transwell migration assay. The image of transwell is shown in (J) and the relative qualification data are present in (K) Data are present as the mean values ± SD (n = 3). ***P < 0.001.
