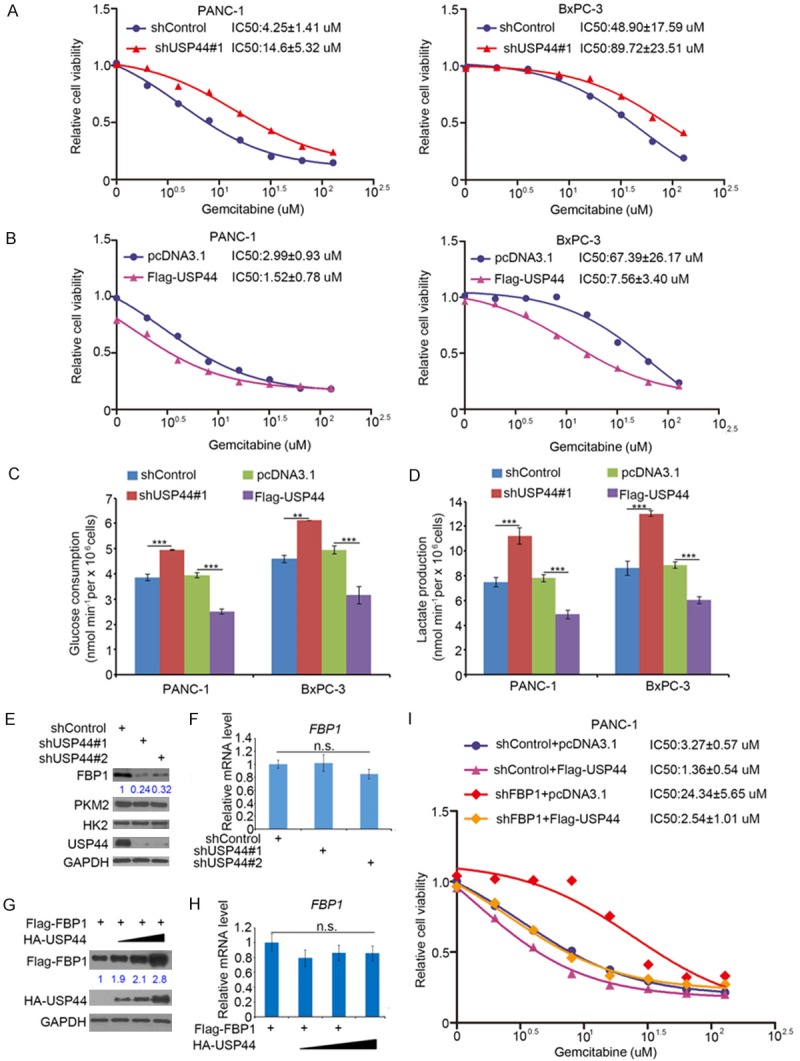
Figure 2.

USP44 overcomes gemcitabine resistance by suppressing the glycolysis in pancreatic cancer cells. (A) Both PANC-1 and BxPC-3 cells were infected with indicated shRNAs. After 48 h, the cells were treated with a serial concentration of gemcitabine for another 24 h. The cell growth rate was evaluated using the MTS assay. The IC50 values of gemcitabine in each group are also shown. (B) BxPC-3 and PANC-1 cells were transfected with indicated plasmids for 24 h. The cells were treated with various concentration of gemcitabine for another 24 h. The cell proliferation rate was evaluated by MTS assay. The IC50 values of gemcitabine in each group are also shown. (C and D) PANC-1 and BxPC-3 cells were infected with indicated shRNA. 48 h post-infection, the spent medium was sent for analysis of glucose utilization (C) and lactate secretion (D). Data are present as the mean values ± SD (n=3). ***P < 0.001. (E and F) PANC-1 cells were infected with indicated shRNAs. After 72 h, the cells were collected for Western blot analysis (E) and RT-qPCR analysis (F). The data are shown as the mean values ± SD (n = 3). n.s., not significant. (G and H) PANC-1 cells were transfected with Flag-FBP1 and a serial dose of HA-USP44. After 24 h, the cells were collected for Western blot analysis (G) and RT-qPCR analysis (H). The data are presented as the mean values ± SD (n = 3). n.s., not significant. (I) PANC-1 cells were infected with indicated shRNAs. 48 h post-infection, the cells were transfected with indicated plasmids for another 24 h. The cells growth rate was evaluated using the MTS assay for calculating the IC50 values of gemcitabine in each group.
