
Figure 4.
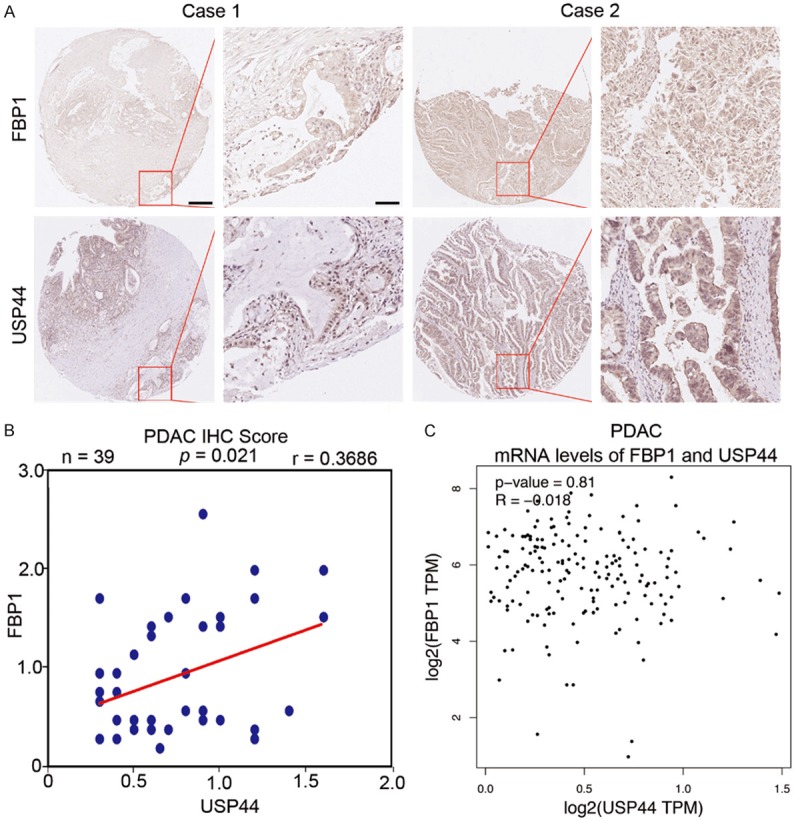
FBP1 protein levels rather than FBP1 mRNA levels are positively correlated with USP44 in PDAC specimens. A. The TMA sections (n = 39 for PDAC) were stained with FBP1 or USP44 respectively. B. Correlation analysis of the IHC scores of FBP1 and USP44 in TMA sections. Pearson’s product-moment correlation co-efficiency and the p-values are also shown. C. Correlation between the mRNA expression levels of USP44 and FBP1 in human pancreatic cancer samples was determined by The GEPIA web tool.