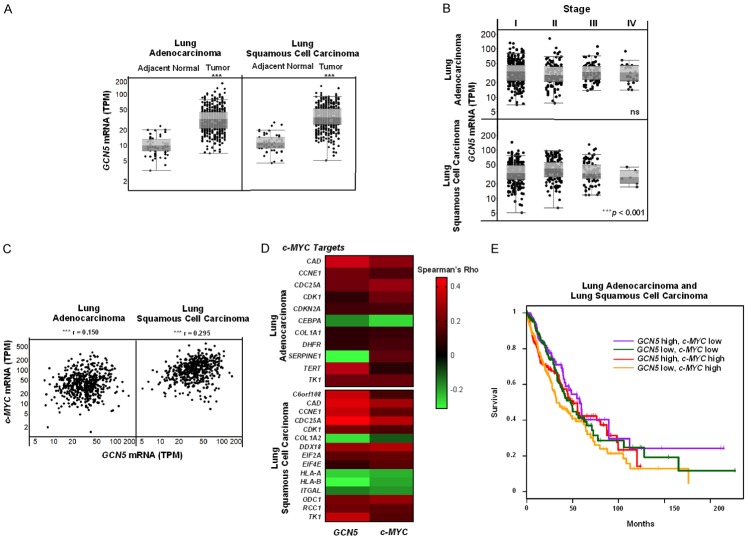
Figure 1.
GCN5 mRNA levels are upregulated and associated with c-MYC and c-MYC target genes in human NSCLC tissues. Public repositories of TCGA were analyzed for (A) GCN5 mRNA levels in human adjacent normal lung (n = 59) and lung adenocarcinoma (n = 517) as well as adjacent normal lung (n = 51) and lung squamous cell carcinoma (n = 501) tissues, (B) GCN5 mRNA levels in different stages (I-IV) of lung adenocarcinoma or lung squamous cell carcinoma, (C) associations between GCN5 and c-MYC mRNA levels in human lung adenocarcinoma and lung squamous cell carcinoma tissues, (D) significant associations between GCN5 and c-MYC to known c-MYC target genes, or (E) GCN5 and c-MYC mRNA levels in relation to NSCLC (both lung adenocarcinoma and lung squamous cell carcinoma) patient survival. Data are represented by (A) box-and-whisker plots, (B) scatter plots, (C) a heat map representing negative (green) versus positive (red) associations, (D) a Kaplan-Meier survival curve where: purple = GCN5 high, c-MYC low (P = ns), green = GCN5 low, c-MYC low (P = ns), red = GCN5 high, c-MYC high (P = ns), and yellow = GCN5 low, c-MYC high (*P < 0.05). High versus low levels are relative to median expression. Symbols refer to ***P < 0.001.

