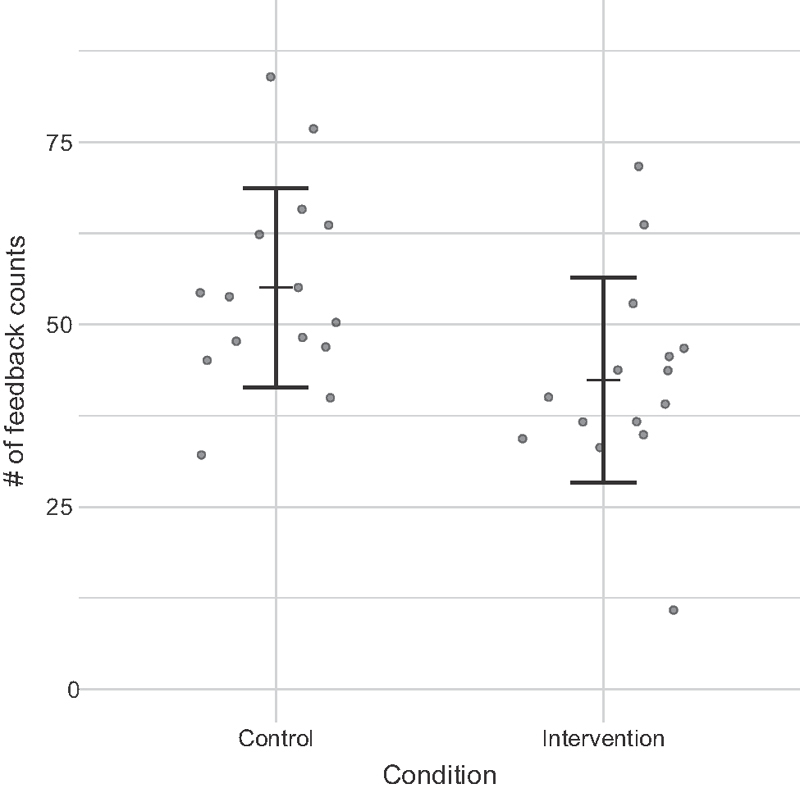
Fig. 9.

Average feedback counts in control and intervention conditions. Dots represent individual participants. We observed statistically significant lower counts in intervention versus control conditions (average counts: 42 vs. 55.07; Wilcoxon, Z = 13.5, p < 0.05).
