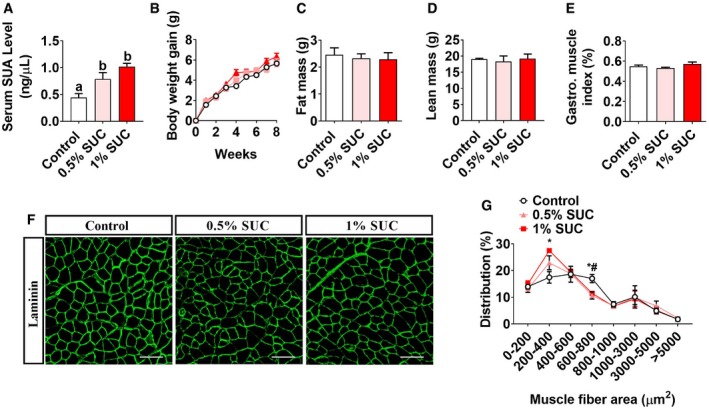
Male C57BL/6J mice were fed with chow diet supplemented with 0, 0.5, and 1% SUC for 8 weeks.
-
A–E
(A) Serum SUA level, (B) body weight gain, (C) fat and (D) lean mass and (E) gastrocnemius index.
-
F, G
(F) Gastrointestinal muscle fiber immunofluorescent laminin staining and (G) frequency histogram of fiber cross‐sectional area. Scale bar in (F) represents 100 μm.
Data information: Results are presented as mean ± SEM (
n = 6–8). Different letters between bars mean
P ≤
0.05 in one‐way ANOVA analyses followed by
post hoc Tukey's tests. *: significant difference (
P ≤
0.05) between 0.5% SUC and control group by non‐paired Student's
t‐test. #: significant difference (
P ≤
0.05) between 1% SUC and control group by non‐paired Student's
t‐test.

