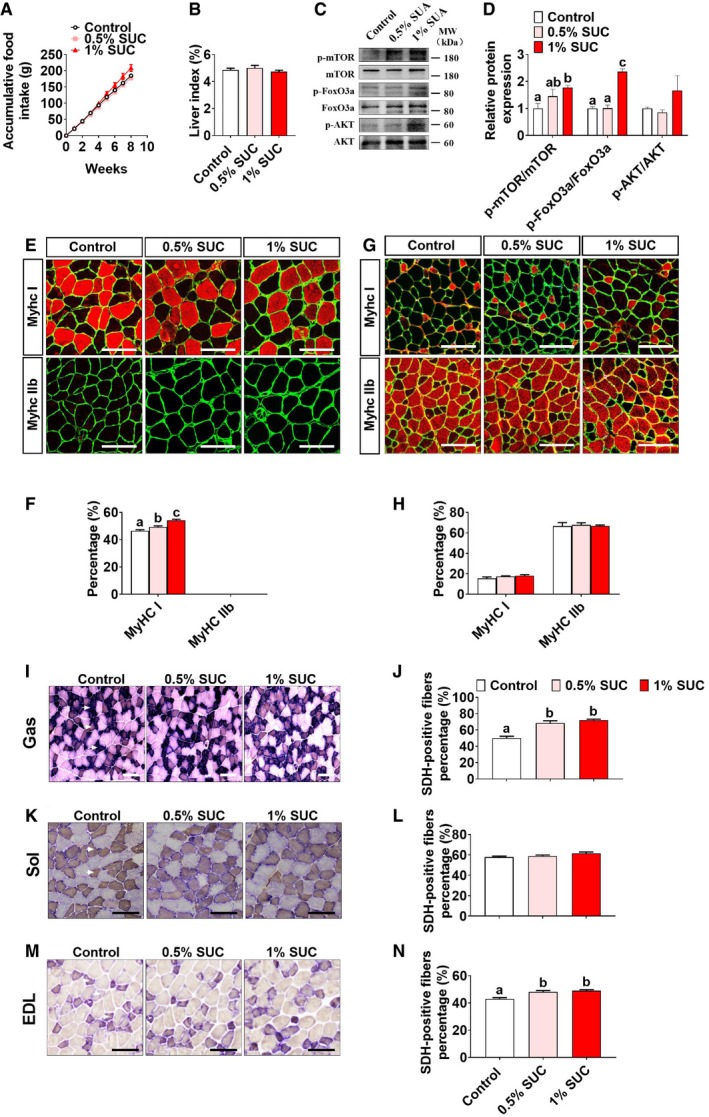
Male C57BL/6J mice were fed with chow diet supplemented with 0, 0.5%, or 1% SUC for 8 weeks.
-
A, B
(A) Cumulative food intake and (B) liver index of mice treated with SUC for 8 weeks (n = 8).
-
C, D
Immunoblots and quantification of p‐mTOR, mTOR, p‐FoxO3a, FoxO3a, p‐AKT, and AKT protein in gastrocnemius (n = 3).
-
E–H
Representative images and quantification of laminin (green), MyHC I (red), and MyHC IIb (red) immunofluorescent staining in the (E, F) soleus and (G, H) extensor digitorum longus muscle. The graphs show the MyHC I and MyHC IIb fiber ratios (n = 6). Scale bar in (E, G) represents 100 μm.
-
I–N
The percentage of SDH positive in the (I, J) gastrocnemius, (K, L) soleus, and (M, N) extensor digitorum longus muscle is shown by SDH enzyme staining. Only darkly stained SDH fibers are treated as SDH‐positive fibers. The graphs show the SDH‐positive fiber ratios (n = 4–6). Scale bar in I, K, and M represents 100 μm.
Data information: Results are presented as mean ± SEM. Different letters between bars mean
P ≤
0.05 in one‐way ANOVA analyses followed by
post hoc Tukey's tests.

