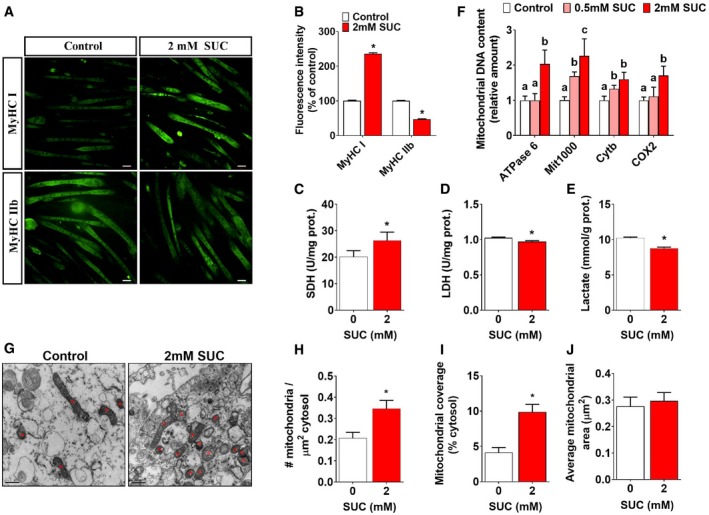
C2C12 cells were treated with 0, 0.5, and 2 mM SUC for 48 h.
-
A, B
Representative images and quantification of MyHC I and MyHC IIb immunofluorescent staining (green) in C2C12 cells (n = 16).
-
C–E
The enzymes activity of (C) SDH, (D) LDH, and (E) lactate production in C2C12 cells.
-
F
Quantification of mitochondrial DNA contents in C2C12 cells.
-
G–J
(G) Mitochondrial electron microscopy showed the (H) mitochondrial density, (I) mitochondrial coverage, and (J) average mitochondrial area in C2C12 cell. Scale bar in (A) represents 50 μm; scale bar in (G) represents 0.5 μm.
Data information: Results are presented as mean ± SEM (
n = 6–8). Different letters between bars mean
P ≤
0.05 in one‐way ANOVA analyses followed by
post hoc Tukey's tests. *
P ≤
0.05 by non‐paired Student's
t‐test.

